

Today, companies have more data than ever, and dashboards have become the natural response. Yet in many organizations, decisions still move slowly. Users can see the data, but getting a real answer to a specific question often means leaving the product, waiting for an analyst, or pulling data into a spreadsheet.
Most analytics platforms are positioned as decision-support tools. In practice, many of them focus primarily on helping users access and explore information. The step from data to an actual decision is still largely left to the user.
In this article, we’ll explore five reasons analytics platforms slow down decision-making and how AI can help remove those barriers.
1. Users Have to Leave the Platform to Find Answers
Most analytics platforms do a good job of surfacing metrics, trends, and anomalies. Users can quickly spot that something has changed:
- Conversion rates suddenly drop
- Customer acquisition costs increase
- Revenue spikes unexpectedly
The challenge begins with the next question: why?
In many organizations, answering that question still requires leaving the dashboard. Users export data to spreadsheets, open separate reporting tools, or ask analysts for help. The information exists, but the path from observation to understanding is often fragmented and slow.
As a result, the time between noticing a problem and understanding it can stretch from seconds to hours or even days. By then, the context may be gone, priorities may have shifted, or a decision may already have been made.
AI changes this dynamic by bringing investigation directly into the analytics experience. Instead of switching tools or relying on specialist support, users can ask questions in natural language and explore the data in the dashboard they already use.
See how this works in the example below.
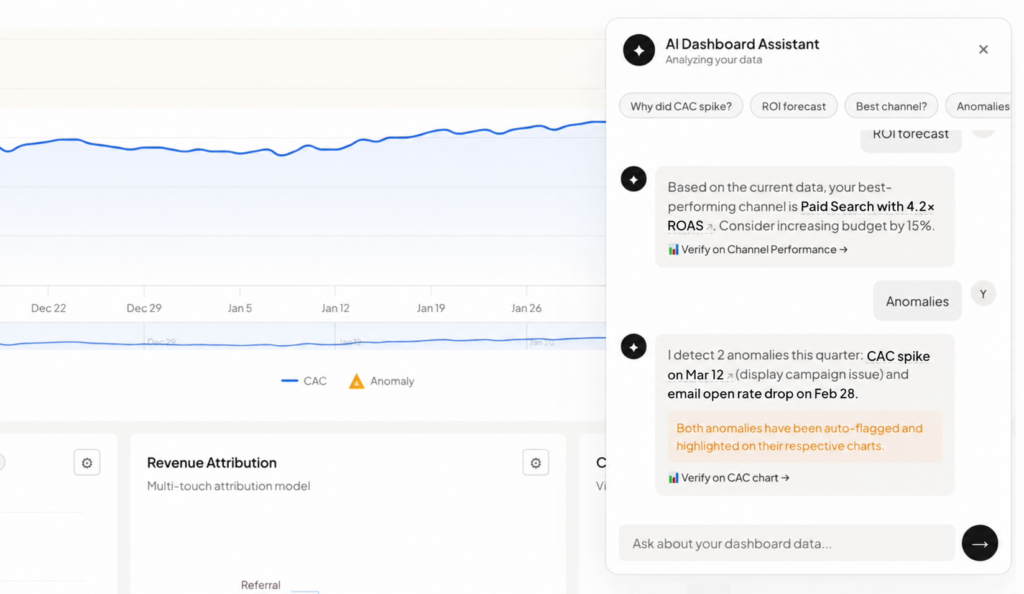
A marketing manager notices that customer acquisition costs (CAC) have been steadily increasing over the last few weeks. Rather than exporting data or contacting the analytics team, they ask the AI assistant to investigate anomalies. Within seconds, the system highlights unusual events, provides relevant context, and points to the most likely areas for further investigation.
The result is a shorter path from observation to understanding. Instead of switching tools and waiting for answers, users can investigate issues in the moment and act faster.
2. Users Spend Too Much Time Finding the Information They Need
Analytics platforms are designed to make data accessible. Yet for many users, getting from a question to an answer still takes more effort than it should.
In many cases, the goal is already clear:
- A product manager wants to understand a drop in engagement
- A sales leader wants to compare regional performance
- A customer service manager wants to identify the most common support topics
Finding the answer is often the difficult part.
Users search through filters, switch between views, open multiple reports, or ask someone else for help. The data is available, but reaching it often takes longer than it should.
AI helps remove this friction by allowing users to interact with analytics using natural language. Instead of navigating through dashboards and reports, users simply describe what they want to know. The system understands the request and returns the relevant information.
See how this works in the example below.
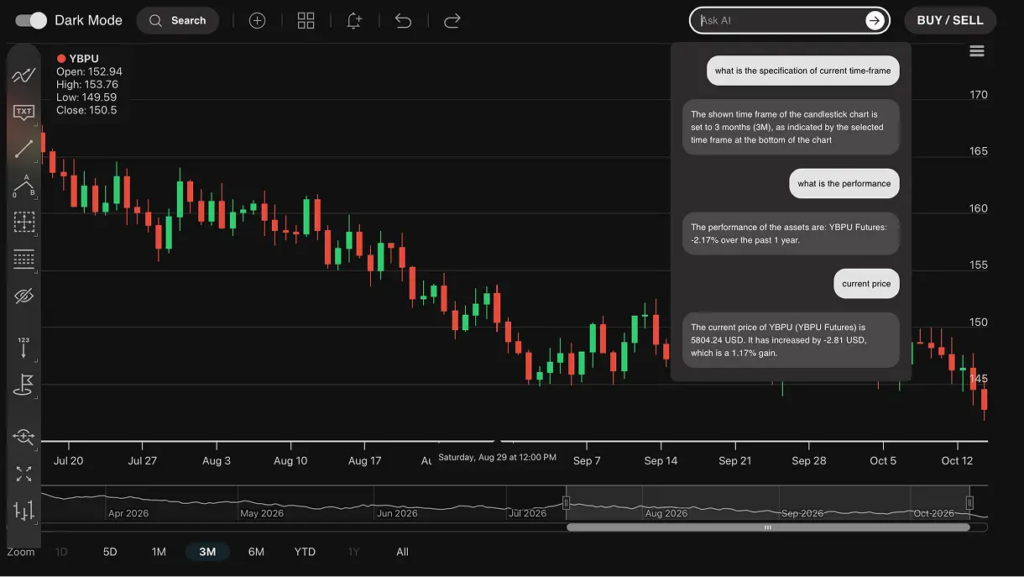
The dashboard above displays market data and trading activity in real time.
In the chat window, a user asks questions about the chart, asset performance, and current market conditions. Rather than manually exploring the interface, they receive the information they need through a simple conversation.
The result is less time spent searching and more time spent acting on the data.
3. One Dashboard Rarely Fits Every User
Most analytics platforms are built around a single view of the data. Everyone in the organization — from the CEO to the product specialist — looks at the same charts, filters, and level of detail. The problem is that different users have different goals, and those goals often require different perspectives on the same data.
When all of them are looking at the same dashboard, at least some of them are not seeing what they actually need.
The traditional solution is to create separate dashboards for different teams and roles. But every new dashboard requires time to design, build, maintain, and update. As reporting needs evolve, the number of dashboards often grows faster than teams can manage. The result is dozens of views. Some of them are outdated, some unused, and nobody is quite sure which one to trust.
AI offers a different approach. Instead of creating a new dashboard for every role and use case, users simply describe what they want to see. The system generates a view tailored to their question.
See how this works in the example below.
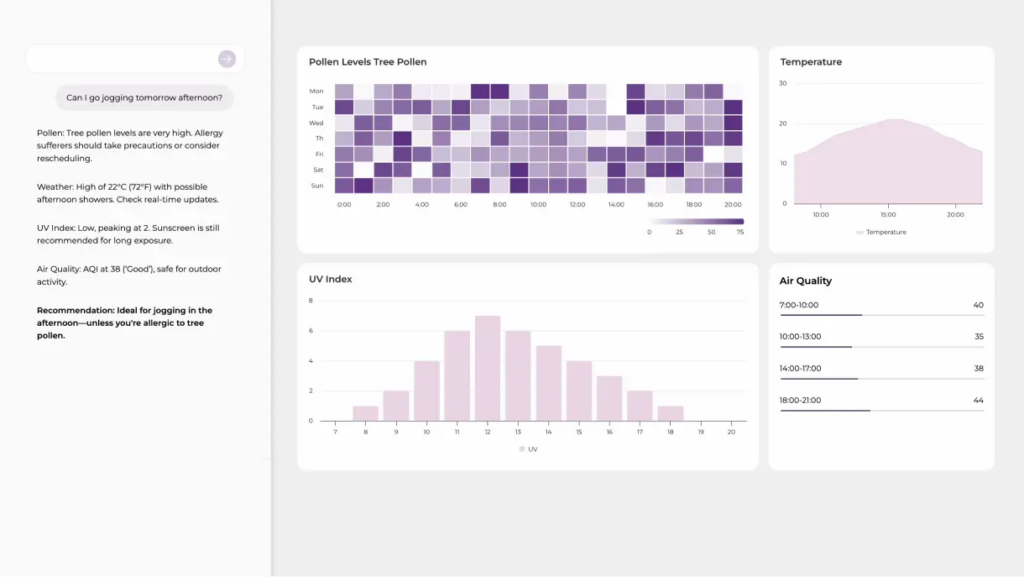
A user wants to know whether conditions will be suitable for jogging tomorrow afternoon. Instead of searching through separate reports for weather, pollen levels, UV index, and air quality, they ask a single question. The system generates a tailored view that brings together exactly the information needed to make a decision.
The result is a more personalized analytics experience. Users get the information they need without waiting for anyone to build it. Data teams spend less time maintaining dashboards that may no longer reflect what people actually need.
4. Critical Signals Are Easy to Miss
Most dashboards show what has already happened. Users can see the current state of their metrics and compare it with previous periods.
They rarely tell users what needs attention.
By the time a business issue becomes obvious, it has often already had an impact.
A campaign underperforms for two weeks before anyone notices. A key metric drifts below target while the team focuses elsewhere.
The data was there the whole time. Nobody was looking at the right place at the right moment.
The longer an issue goes unnoticed, the greater its potential business impact. In many environments, even a few hours can make a meaningful difference.
AI reverses this model. Instead of waiting for users to notice something unusual, the system continuously monitors data and surfaces anomalies automatically, directly within the analytics experience.
Users do not need to inspect every chart manually or know in advance what might go wrong. The system identifies unusual patterns, provides context, and highlights issues where they are most relevant.
Take the example below.
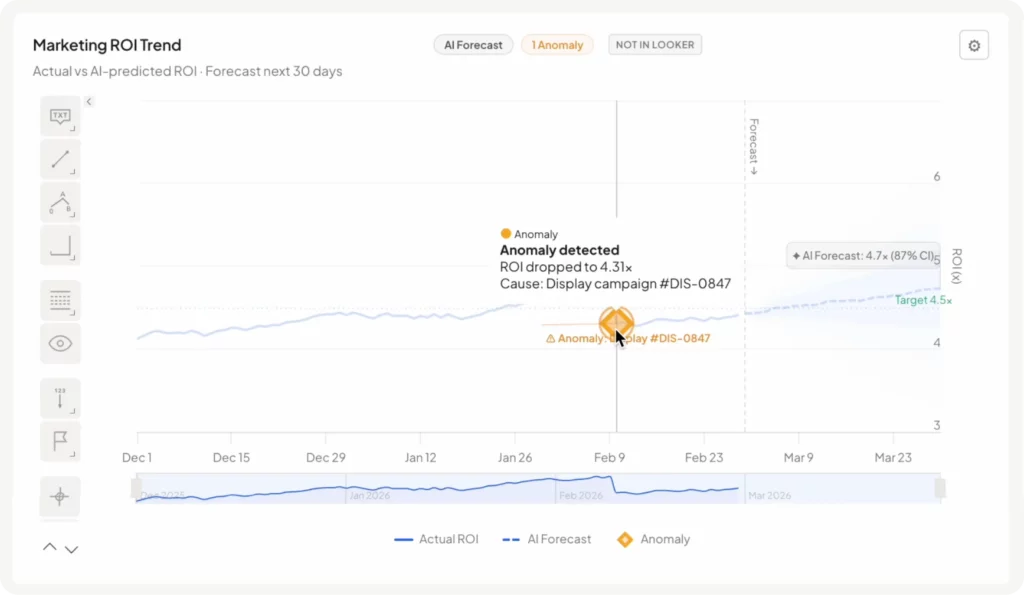
A marketing team sees an unexpected drop in campaign ROI. The system flags it on the chart, identifies a likely cause, and shows what the next few weeks are expected to look like. No separate analysis needed.
The result is a shorter gap between detection and action. Issues that might otherwise surface during a weekly review can be identified and investigated the same day.
5. Users Struggle to Turn Data Into Decisions
There is a difference between data being visible and data being understood.
Most dashboards do a good job of presenting information. They show metrics, trends, and comparisons. But turning that information into a decision is often left entirely to the user.
- A trend line has been flat for three weeks. Should someone be concerned?
- A campaign is generating more leads than usual. Is that a success, or a sign of declining lead quality?
The data is visible, but the meaning is not always obvious.
For experienced analysts, interpreting these signals is part of the job. For everyone else, uncertainty often leads to hesitation. The insight gets noticed but never turns into action.
AI helps close this gap by adding a layer of interpretation. The system proactively identifies meaningful changes, provides context, and highlights what is actually worth paying attention to.
The result is that dashboards stop being passive displays and start helping users make decisions with greater confidence.
Wondering About Adding AI to Your Analytics Platform?
The AI examples in this article have one thing in common: they reduce the distance between information and action.
Instead of making users search, navigate, interpret, and investigate on their own, AI helps bring those steps closer to the data itself.
Gartner estimates that by 2027, half of all business decisions will be augmented or automated by AI agents. As that shift continues, analytics platforms will need to do more than display information. They will need to help users understand it, identify what matters, and act on it.
At Black Label, we help organizations bring AI into data-rich products, enabling users to move from insight to action faster.
If you’re exploring how this technology could improve the user experience of your product, learn more about our AI services.