

The role of the Chief Investment Officer in investment organizations is evolving in a world where the volume of processed data is constantly increasing, alongside technological progress. In a world of multi-source information, growing numbers of strategies, regulatory pressure, and instant market reactions, the CIO is no longer merely an allocation decision-maker. They are becoming a decision architect – responsible for ensuring the organization sees its portfolio clearly, consistently, and on time.
Despite significant investments in trading systems and market data, many investment firms still struggle with fragmented information, manual processes, and tools that cannot keep up with market speed. Data exists, but does not form a coherent decision-making picture. Information is available but often delayed, out of context, or difficult to interpret quickly.
As a result, key investment decisions are made more slowly, cautiously, or based on an incomplete view of risk and performance. In such an environment, competitive advantage no longer comes from access to data but from the ability to visualize it clearly and use it in real time.
From Allocation to Investment Process Orchestration
In modern investment organizations, the CIO is responsible not only for portfolio performance but for the quality of the entire decision-making process. Their role is to create an environment where portfolio managers, analysts, and risk teams work from the same data, understand it in the same way, and can quickly translate insights into action.
Investment decisions today occur under high volatility, complex multi-asset portfolios, and pressure for transparency. Without a consistent data view, the CIO loses the ability to manage risk, execute strategies, and maintain team efficiency effectively.
The scale and pace of change in the asset management industry – including growing product complexity, cost pressure, technological transformation, and the rise of alternative data – mean even well-functioning investment models begin to show their limitations.
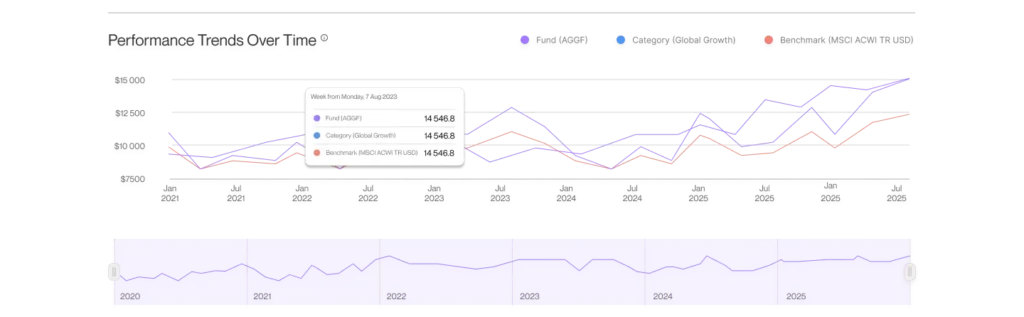
Performance visualization is no longer just a reporting function; it becomes an operational tool for the CIO, enabling a quick understanding of the relationship between performance, risk, costs, and allocation decisions in a single coherent view.
The following challenges are based primarily on our observations and experiences working with investment firms, as well as market analyses presented in the Deloitte Center for Financial Services report.
Fragmented Data and Lack of a Single Portfolio View
Challenge
The CIO faces an incomplete and inconsistent portfolio view. Data is spread across trading systems, brokers, risk management tools, accounting, and spreadsheets, each showing different realities with varying update frequencies. Comparing strategies, analyzing exposures, or assessing risk requires manual consolidation, slowing decision-making, and increasing the risk of errors. As portfolio complexity grows – particularly with alternative assets such as private credit exceeding $2.1 trillion AUM globally – maintaining information consistency without a central data model becomes increasingly difficult.
Solution
Consolidating all data into a single analytical environment creates a unified, near real-time portfolio view. Data from different sources is standardized and presented in a consistent structure, enabling rapid comparisons and analysis without manual adjustments. Performance visualization acts as an integrating layer, organizing data into a logical decision model that allows the CIO to analyze portfolios by strategy, asset class, alpha sources, costs, and risk in one comprehensive view.
Impact on the Business
The CIO gains complete visibility over the portfolio and can make faster, more confident decisions with reduced risk of errors. The organization minimizes information chaos, improves consistency of analysis, and accelerates inter-team alignment. The CIO no longer “collects the portfolio picture” from multiple reports but manages it through a single visual environment that supports strategic decisions and ongoing oversight. In markets where assets in new structures, such as actively managed ETFs, are growing faster than traditional products, data consistency becomes essential for business scalability.
Delayed Access to Information and Slowed Decisions
Challenge
The market does not wait for reports. Delayed access to information limits the CIO’s ability to respond quickly to market changes, rising risk, or emerging investment opportunities. Decisions are reactive rather than proactive. Despite growing interest in using AI for data and distribution, only a small portion of firms apply these solutions at a scale that meaningfully shortens time-to-insight.
Solution
Modern performance visualization enables real-time portfolio monitoring through interactive dashboards. Data is automatically updated, and key metrics are immediately available without generating static reports. Interactive performance visualization shifts the process from static reporting to continuous monitoring – allowing the CIO to see not only current results but also their sources, changes over time, and the impact of costs and fees on net performance.
Impact on the Business
Shortening time-to-insight allows the CIO and investment teams to act faster and more confidently. The organization responds better to market volatility, limits losses caused by delays, and exploits emerging opportunities more effectively. Shorter time-to-insight directly reduces time-to-decision, which has measurable financial value in highly volatile markets.
Lack of an Ergonomic Interface for Investment Teams
Challenge
The CIO loses control over how data is analyzed and interpreted. Different teams draw different conclusions from the same data, reducing decision consistency and increasing the risk of investment errors. Over time, the absence of a shared analytical environment also hinders scaling AI and automation initiatives.
Solution
Ergonomic investment data visualization designed for business users enables fast comparisons, drill-downs, and intuitive trend understanding without technical knowledge. Well-designed performance visualization becomes a common language for the investment organization, allowing portfolio managers, analysts, and risk teams to work from the same data views instead of creating parallel interpretations in Excel.
Impact on the Business
Investment teams work faster, more consistently, and more efficiently. The CIO gains confidence that decisions are based on a unified data view, improving portfolio management quality and reducing operational risk. C-level executives regain control over how data is consumed and interpreted without imposing rigid reporting processes.
Hidden Opportunity Costs
Challenge
The CIO cannot fully see where capital is working inefficiently or where it could generate higher returns at acceptable risk levels. Lack of quick performance, cost, and risk comparison makes optimal resource allocation difficult.
Solution
Consistent visualization of performance, costs, and risk allows portfolio analysis in relative terms, not just absolute. The CIO can quickly identify underperforming segments and make capital reallocation decisions. Performance visualization enables relative analysis, showing how strategies perform not only in gross terms but also net of all costs and fees.
Impact on the Business
Better visibility into opportunity costs leads to more informed capital allocation, improved long-term performance, and increased investor value. Organizations stop losing potential gains from delayed or suboptimal decisions. Capital reallocation decisions are based on actual efficiency rather than nominal returns.
Single Source of Truth as a Foundation for Decision-Making Advantage
Challenge
The CIO must manage an organization where different teams rely on inconsistent data sources and definitions. This makes fast decision-making difficult and weakens confidence in the data. This limits the ability of teams to focus on investment decisions and their impact.
Solution
Building a single, unified source of investment data that serves as the foundation for all analysis and visualization ensures consistency and reliability across the organization. Performance visualization becomes the natural interface to the single source of truth – through it, the CIO and investment teams consume data, test scenarios, and assess the impact of decisions.
Impact on the Business
The organization operates faster, more predictably, and with lower risk. The CIO can focus on strategy and results rather than resolving issues caused by inconsistent data. As a result, the organization builds a coherent decision-making architecture where data, visualization, and the investment process reinforce each other.
Summary: Performance Visualization as a Strategic Tool
Modern investment advantage comes not from having more data but from the ability to interpret it clearly and use it quickly. Organizations that can see their data clearly and in an integrated way make better decisions, respond faster to market changes, and build long-term value more effectively. For the CIO, performance visualization is no longer just a reporting tool but a strategic infrastructure element – enabling full control over where and how the portfolio generates value and where uncontrolled outflows occur due to costs, fees, and inefficient capital allocation. Discover all the features available here.