

Got your 3D glasses ready? No? All right, maybe you’ve got the rare ability to see in 3D without them. Either way, get comfy in your cinema seat as today we’re watching a 3D movie about 3D charts. Popcorn optional. Clarity… Well, we’ll see about that.
What are 3D Charts?
3D charts are data visualizations where a third dimension (depth) is added to the traditional X and Y axes. This extra axis (called the Z Axis) represents an additional data variable. Unfortunately, they’re not that popular in daily business usage, and there’s a reason for that – the third dimension often ruins the clarity and adds nothing to most charts.
But before we look at when they work well – and when they don’t – let’s first check out a 3D chart that actually makes sense.
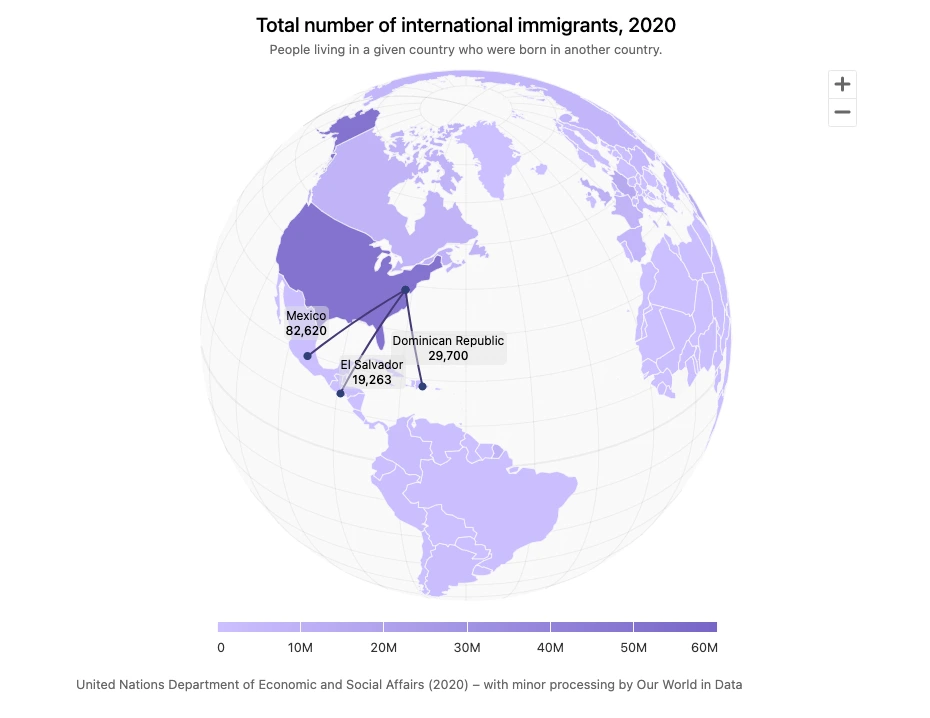
That’s how a Geo 3D chart should look. Good dataviz really does make a world of difference. Explore the movement of people across Central & North American in 2020 – source.
A spherical map of the Earth is a perfect example of good usage of 3D magic. It shows the Earth more accurately, avoiding the distortions that are common in flat 2D charts/maps. It allows you to rotate and zoom, making exploration more interactive and intuitive. You get a better sense of distances, positions, and global connections.
Examples of the best data for 3D charts include:
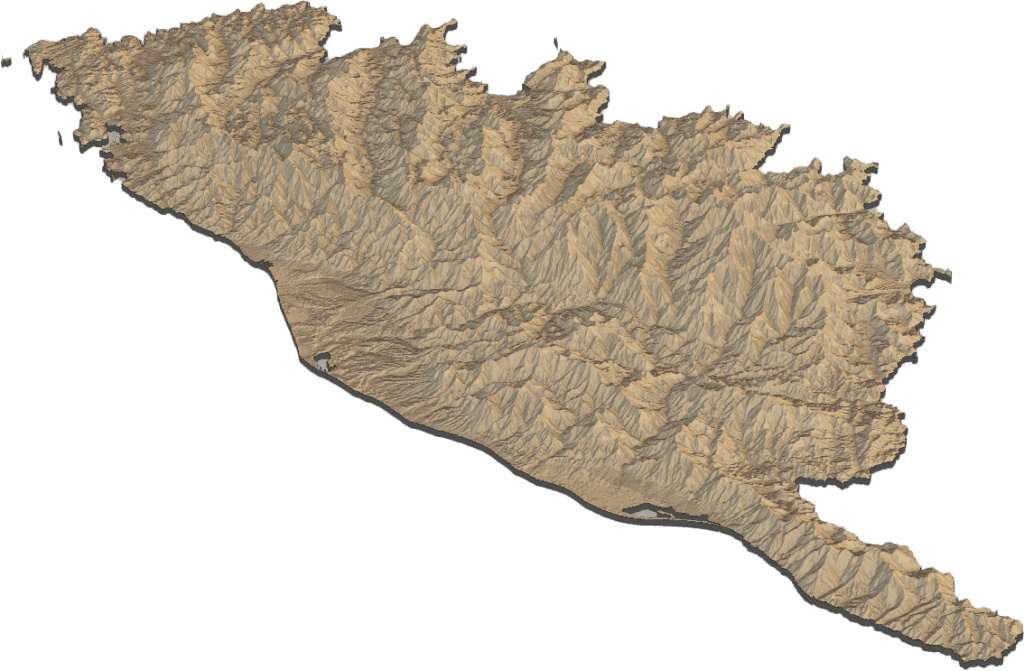
- Topographical Data: These capture terrain elevation and surface temperature gradients, supporting modeling, planning, and geospatial analysis.
- Molecular Models Data: These represent the spatial arrangement of atoms in a molecule and are crucial for understanding chemical reactions, drug design, and material properties.
- 3D Brain Scans and Medical Imaging Data: These datasets enable detailed visualization and the analysis of internal biological structures, aiding in diagnosis.
All these examples have one thing in common: they represent complex, high-dimensional data that require spatial understanding. We’ll explore them later – now let’s look at the worst uses of 3D charts and when to definitely avoid them.
When You Shouldn’t Use 3D Charts
To be honest, you don’t really need to use 3D charts unless you’re working with truly complex data that demands a third dimension. In most everyday cases, 3D charts only make your visuals harder to read without adding any real value.
Now it’s time for some clear situations in which you definitely shouldn’t use 3D charts – and what to use instead:
Presenting or Comparing Simple Datasets
- Showing student test scores?
A 2D scatter plot works best—it’s ideal for spotting performance clusters, gaps, or outliers.
- Tracking daily customer support tickets?
Use a 2D line or area chart to visualize volume trends, peak days, and improvements over time. If you’ve just released a new version of your product, you’ll likely see a spike—but whether that’s a good sign or a red flag…
- Comparing daily step counts across months?
If it’s a short time span, go with 2D bar or column charts for an easy month-to-month comparison. For longer datasets, a line or area chart offers smoother insight into trends and consistency.
Finances & Business
- Tracking the value of financial instruments over time?
A 2D line chart is your go-to. It’s clean, precise, and perfect for showing trends or long-term growth (or degrowth).
- Comparing sales from recent quarters?
That’s categorical data. Use a 2D bar or column chart to make comparisons across time periods quick and easy.
- Monitoring departmental budgets or spend breakdowns?
Stick with 2D bar charts for raw values, or go for a 2D donut chart if you’re focusing on proportions.
Before we move to the sections in which I’ll tell you where 3D charts actually make sense (yes, they exist), let’s first look at some truly awful examples of 3D chart misuse…
The Worst 3D Charts
Some 3D charts are so bad they deserve a spot in a design hall of shame. They try to look impressive but end up hiding the data behind angles, shadows, and confusion. Let’s look at the worst offenders and what makes them so misleading.
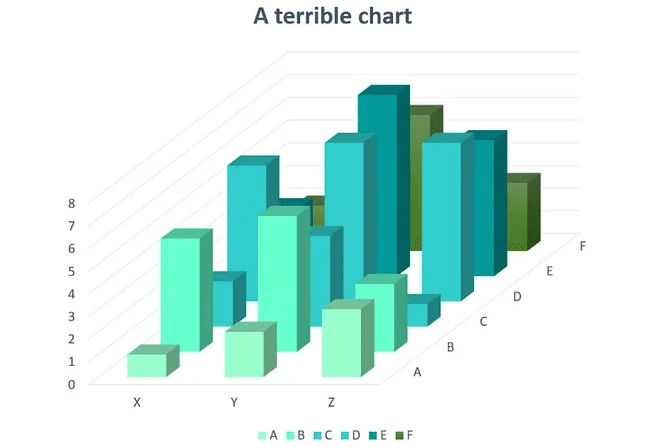
A Terrible 3D Column Chart
A column chart that has 6 series spread across 3 axes is a recipe for confusion. The front columns block the ones behind, depth kills clarity, and the third dimension adds zero value. Worst of all, it’s nearly impossible to tell what the actual values are.
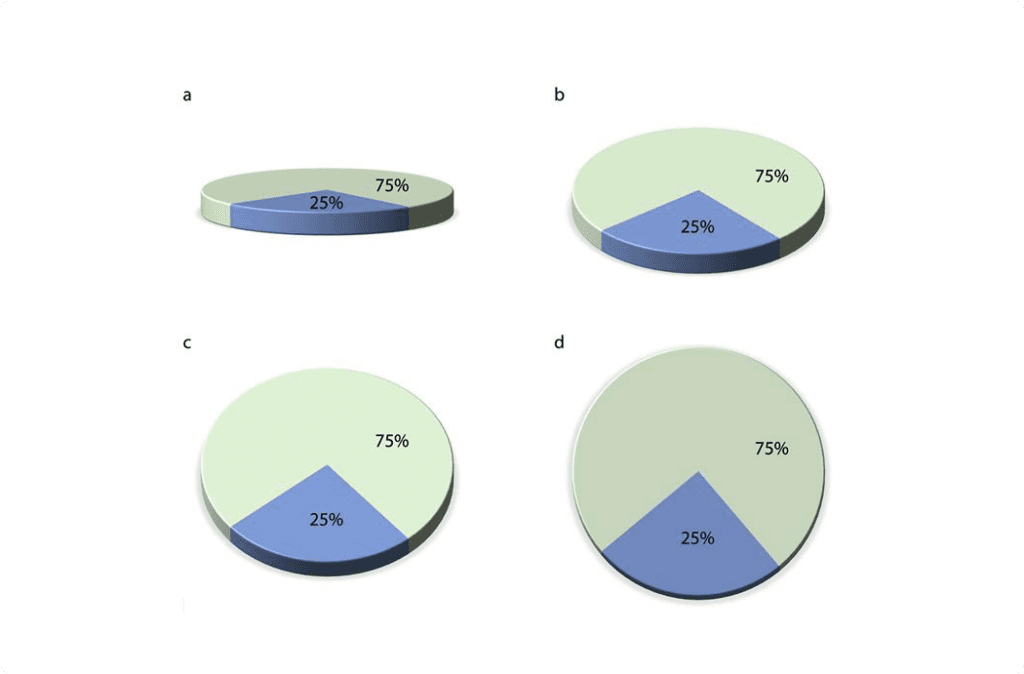
An Awful 3D Pie Chart
Here’s a 3D pie chart – a classic example of form over function. Our eyes aren’t great at estimating quantity from angles, which is the skill needed. Add a 3D perspective, and it gets worse: distorted slices and no added value. The fix? Start by flattening it to a 2D pie or donut chart, then consider switching the chart type to a bar chart for maximum clarity.
3D charts usually do more harm than good. Perspective distorts values, depth often hides clarity. Most of the time, they confuse more than they communicate.
But, as I mentioned earlier, there are use cases in which they excel. Let’s take a look at those.
When to Use 3D Charts
While 3D charts are often more trouble than they’re worth, there are a few scenarios where they can actually become a great companion for your data. If your data has a strong spatial element – like depth, volume, or geography – 3D charts are your go-to here.
Let’s look at a few examples where 3D charts excel:
Displaying Geo-spatial Datasets
When you’re working with maps, terrain, or any kind of geographical data, 3D can help highlight elevation, density, or distribution in ways 2D just can’t. It adds a layer of context that’s especially helpful for urban planning, climate modeling, and logistics.

Showing Molecules and Particles
Visualizing molecular structures or particle simulations is where 3D really shines. Seeing atoms in space, their bonds, and how they interact provides insights that 2D projections simply can’t deliver.

The Bottom Line
3D charts are a cool concept, but in most cases, they’re not the right choice. 3D charts are visualizations that add a third axis to represent depth. While this sounds useful in theory, most business and analytical use cases don’t benefit from the extra dimension. In fact, it often distorts the data and confuses the viewer.
That being said, there are some scenarios where 3D charts shine. When working with complex spatial data like geographic models, molecular structures, or medical imaging, 3D charts can offer insights that 2D charts simply can’t.
Still, for most purposes, stick to 2D. They’re cleaner, simpler, and do a better job of communicating your data clearly and accurately.