
Budget management is complex, not only in large corporations but also in smaller companies and even when it comes to personal finances. There is a clear need to simplify this process, a demand for tools that allow the effective tracking of key financial indicators. One of the most powerful tools in this field is financial dashboards – interactive tools that visualize key financial metrics, support decision-making processes, and help manage finances in real time.
What are Financial Dashboards?
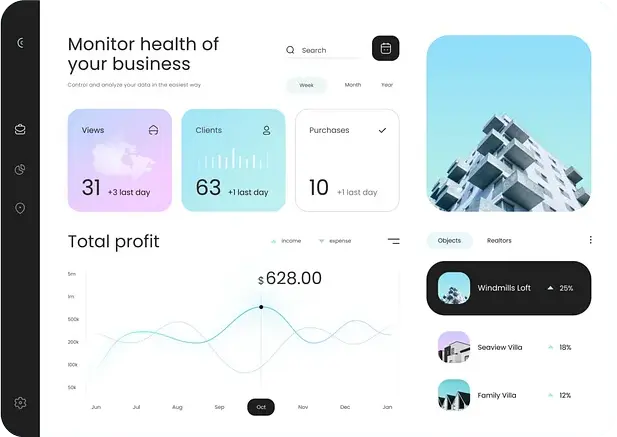
Financial dashboards are visualization tools that bring together key financial indicators and business data in easy-to-understand views. Instead of digging through complex spreadsheets and reports, dashboards enable quick insight into critical metrics like revenue, profits, cash flow, and budget performance. A good financial dashboard is your financial cockpit – everything you need to steer your business at a glance.
By using appropriate charts, graphs, and color schemes, financial dashboards enable the swift identification of trends, anomalies, and areas that require attention. These dashboards are particularly useful for Chief Financial Officers (CFOs), financial analysts, and managers responsible for financial planning and analysis (FP&A).
Why Are Financial Dashboards Important?
Modern businesses require tools that facilitate real-time monitoring of key financial metrics, and financial dashboards offer an ideal solution. They enable quick decision-making by providing managers with immediate access to the latest financial data, allowing them to respond to changes in the business more swiftly and effectively. Additionally, by utilizing historical data and forecasts, financial dashboards improve the quality of planning, helping businesses make more accurate predictions about future expenditures and investments. Furthermore, financial dashboards enhance communication by ensuring that all team members have access to the same up-to-date data, fostering better collaboration and more informed decision-making across the organization.
Key Benefits of Using Financial Dashboards
Implementing financial dashboards in a company can bring several advantages:
- Real-time monitoring: Financial dashboards allow for the continuous tracking of key financial metrics, such as cash flow, profits, and profitability.
- Time-saving: With integrated data, dashboards eliminate the need to manually gather information from various sources.
- Error reduction: Automatic updates and integration with ERP systems help avoid errors that can occur when manually entering data.
- Better forecasting: By using past data and projections, financial dashboards support more accurate predictions of future financial outcomes.
- Enhanced collaboration: The team can work with the same up-to-date data, promoting better coordination and strategic decision-making.
Traditional Dashboards vs Financial Dashboards
Traditional dashboards, like those described in our previous Dashboard article, are versatile data visualization tools that aggregate key information from various sources into one easy-to-view location. Their primary purpose is to generally support business decisions by providing quick access to diverse metrics, regardless of their nature – be it operational, marketing, or sales data. Financial dashboards, however, while built on the same principles of clarity and effective visualization, are specialized tools designed exclusively for monitoring and analyzing financial data. They focus on metrics such as revenue, profits, cash flow, and expenses, offering a much deeper and more contextual insight into a company’s financial health. This means that instead of a general business overview, we get a concentrated financial perspective, which allows for more precise budgeting decisions, strategic investment planning, and faster reactions to market changes that directly impact the organization’s economic condition.
Types of Financial Dashboards
Depending on the company’s needs, there are many types of financial dashboards that can help monitor different financial aspects. Here are some of the most popular types:
Executive Dashboard
Designed for top management, offering a high-level overview of the company’s financial performance. This dashboard usually displays key performance indicators (KPIs) and summarizes financial health, providing rapid insights for decision-makers.
P&L Dashboard (Profit and Loss)
This dashboard helps track revenue and expenses, making it easier to assess profitability. It presents net and gross profits and lets you monitor income streams and costs. As a result, you get a clear view of your financial health over a selected period.
Cash Flow Dashboard
Tracks the inflows and outflows of cash, helping businesses maintain liquidity. This type of dashboard is especially valuable for companies that need to monitor their cash position closely. It helps ensure they can meet obligations, manage expenses, and plan future investments.
Budget vs. Actual Dashboard
Compares planned expenses with actual spending to support budget control. It highlights deviations and shows where adjustments are needed, helping businesses stay aligned with financial goals.
KPI Dashboard
Tracks key performance indicators tailored to a specific industry or organization. It includes custom KPIs aligned with strategic goals—such as sales, profitability, customer acquisition, or operational efficiency.
Financial dashboards can be customized based on your business objectives. One of the key advantages of financial dashboards is their ability to be customized to meet your specific business needs. Whether you’re tracking cash flow, monitoring budget performance, or evaluating profitability, a dashboard can be tailored to highlight the most relevant metrics for your organization.
You can customize both the displayed data and the visual elements. This makes the dashboard intuitive and focused on your team’s priorities. This level of personalization improves decision-making and streamlines financial processes. It also provides real-time insights to help you stay aligned with your business goals.
Components of Effective Financial Dashboards
To ensure that a financial dashboard is effective, it must include several key elements. We divide them into the mandatory and optional components. Check out the list with their short descriptions:
Mandatory Components & Functionalities
KPIs – Key Performance Indicators track core financial metrics. These include profit ratios, cash flow, margins, and debt, offering quick insight into financial health.
Data Source Integration – A dashboard must integrate with systems like ERP, CRM, and spreadsheets. This keeps data consistent, reliable, and always up to date.
Data Refresh Frequency – Automatic refresh ensures the dashboard shows current data. This gives decision-makers the latest financial information at all times.
Visual Design and User Experience (UX) – A good dashboard uses clear visuals like charts and graphs. This improves clarity, usability, and quick data interpretation.
Additional Components & Functionalities
Drill-Down and Filtering Capabilities – Dashboards should let users filter and drill into data for detailed analysis. This applies by department, time, or other criteria.
User Roles and Permissions – User roles and permissions let organizations control dashboard access. This ensures the right data is shown to the right people.
Alerts and Thresholds – Alerts notify users when metrics hit critical levels. This lets teams respond quickly to issues like budget overruns or cash flow problems.
Mobile Accessibility – Mobile access helps decision-makers track and act on data while away. It’s especially useful for traveling executives and managers.
Historical Comparison and Benchmarking – Dashboards should compare current results with past data or benchmarks. This reveals trends, progress, and areas needing improvement.
Export and Sharing Options – Exporting data and reports in formats like PDF or Excel helps share insights. This makes communication with stakeholders more efficient.
Custom Metrics – Custom metrics let businesses track specific indicators. This tailors dashboards to company needs and aligns data with strategic goals.
Optimizing Data Visualization in Financial Dashboards
For a financial dashboard to be truly effective, it must prioritize clarity and ease of understanding. The design elements, such as the type of chart, color scheme, and overall formatting, play a critical role in transforming raw financial data into actionable insights. For example, using line graphs or bar charts to represent financial trends over time makes it easier for decision-makers to spot upward or downward movements at a glance. A well-chosen color palette can highlight key information, like a profit margin or cash flow, making it immediately clear where attention is needed. In addition, formatting should focus on minimizing clutter, presenting data in a way that’s not overwhelming but rather intuitive and digestible.
By focusing on effective data visualization, financial dashboards allow decision-makers to quickly comprehend complex financial situations, empowering them to make informed decisions without needing to sift through extensive reports or data sets. This streamlined access to vital information is essential for businesses seeking to stay agile and responsive in a fast-paced environment.
Examples of Real-World Financial Dashboards
Here are some real-world examples of how financial dashboards are used:
- Cash Flow Monitoring Dashboards: These dashboards track cash inflows and outflows, ensuring that businesses can assess their liquidity and make adjustments if necessary. They provide a detailed view of receivables and payables, showing whether the company has enough cash to cover operational costs and planned investments.
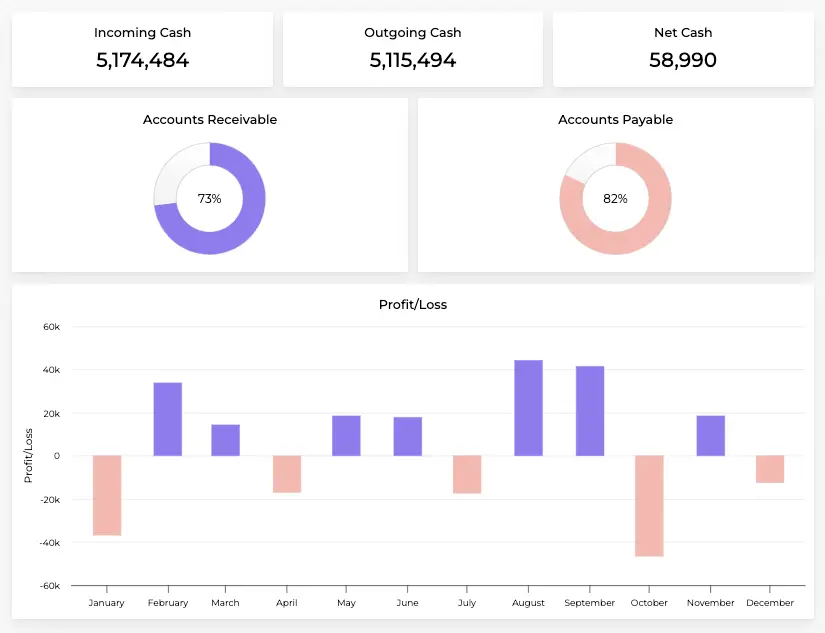
In which directions is the money flowing in your company? Know for sure in real time with a cashflow monitoring dashboard.
- Budget vs. Actual Dashboards: These dashboards help businesses stay on top of their budgets by comparing planned vs. actual expenditures. The comparison can be done in categories such as marketing, production, or operational costs, enabling managers to see where overspending or underspending is occurring and make necessary adjustments to remain on target.
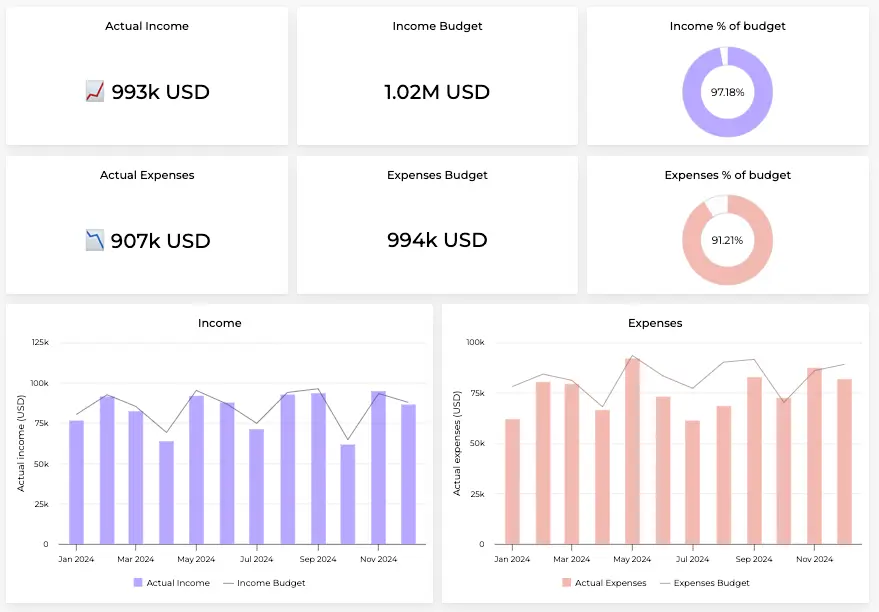
Will income cover all of the company’s monthly expenses? A good Budget vs Actual dashboard will reveal the truth with an impressive amount of granularity.
- KPI Dashboards for Specific Goals: These dashboards track company-specific KPIs, such as customer acquisition costs, return on investment (ROI), or employee performance. They help businesses measure progress against specific objectives, allowing for a more focused approach to achieving strategic goals.
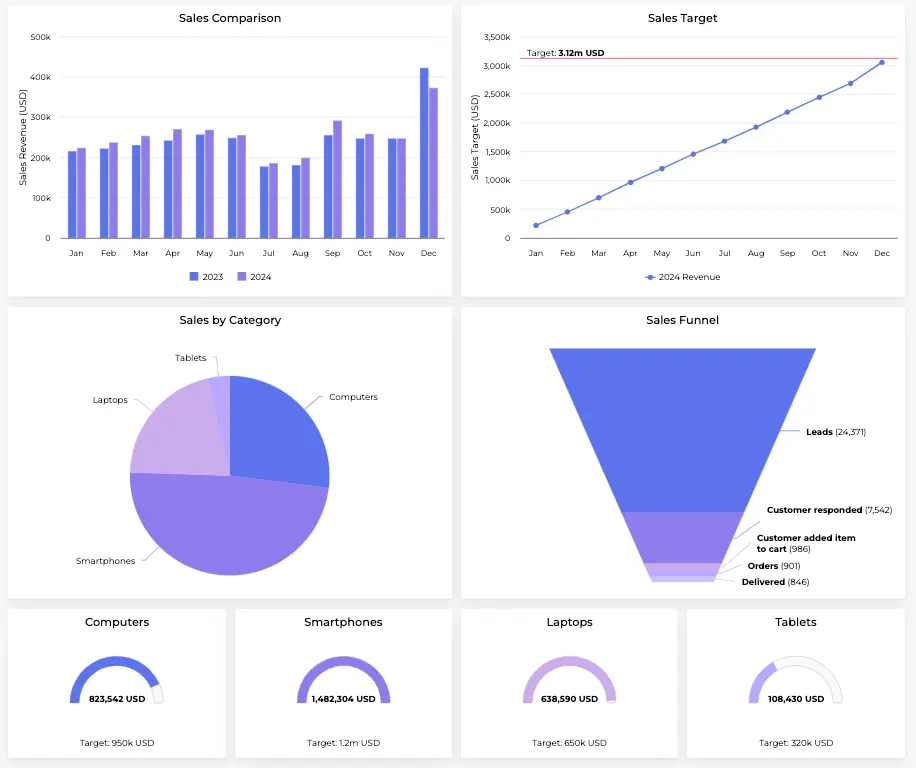
How fast is your company achieving specific goals? Decision makers can check in at any time to get the latest business goal data with a KPI-specific dashboard.
Financial Dashboards can be tailored to suit various organizational needs. Customization is key to ensuring the dashboards are aligned with your business strategy. With the right dashboard, businesses can monitor multiple departments, track performance across markets, or even customize reports for investors or stakeholders.
Conclusion: How Financial Dashboards Enhance Process Quality
In conclusion, financial dashboards are powerful tools that support financial processes within a company. They enable quick monitoring of performance, better forecasting, and data-driven decision-making. For businesses looking to optimize their financial processes, implementing such solutions can be crucial.
If you’re looking for a partner to help you create customized financial dashboards that lead to better financial management and more accurate decision-making, schedule a free consultation with one of our experts here.