
Data is the new oil that fuels the modern-day technological global business engine.
While the first machine learning papers were published in the 1950s, the concept of artificial intelligence was coined even before that, by Alan Turing during World War II.
So, why are we only hearing about it now?
The explanation lies in Moore’s Law. Computational power has increased more than a billion times since the 1960s—and the vast accumulation of data. Over the decades, we have gathered billions, if not trillions, of data points.
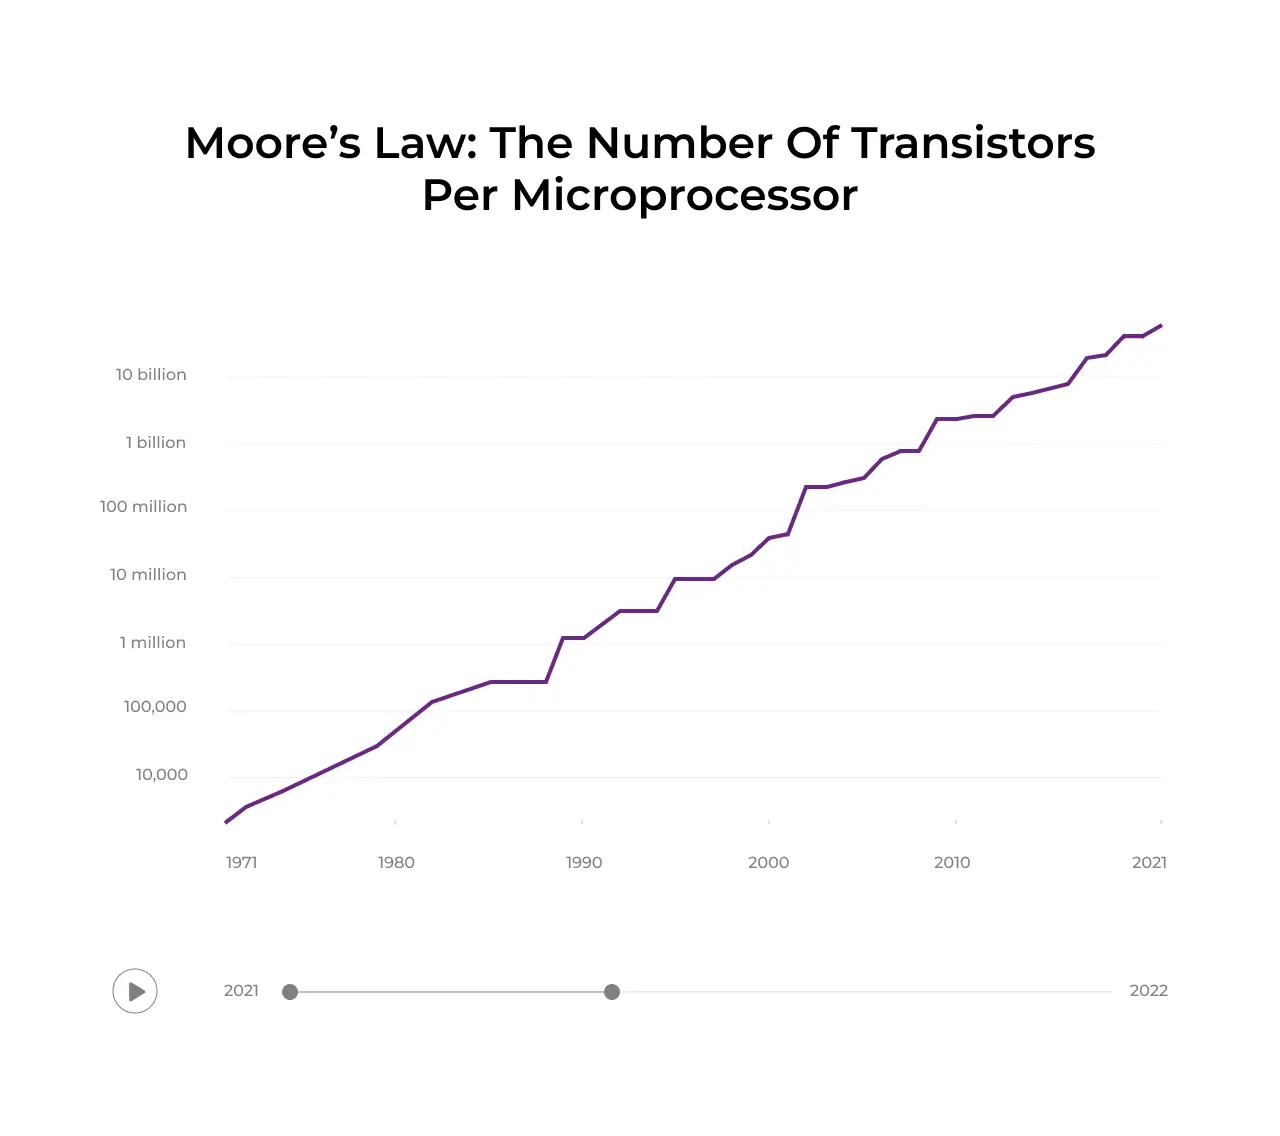
A graph illustrating Moore’s Law which predicts the exponential growth in the number of transistors in microprocessors over time.
But chatbots are not the only revolutionary tools.
Right now, visuals are easily generated in computer programs. AI has made it easier than ever. You can generate ultra realistic images or mockups with Midjourney, funny meme videos with LoomAI, interactive charts with Highcharts GPT. You are even able to create aerodynamic simulations in engineering programs (check out Dataviz at SpaceX).
As AI continues to advance, it brings innovation to many areas, including data visualization. Let’s explain what exactly is AI data visualization
Discover AI-based Dataviz
It refers to the process of representing complex datasets in visual formats such as charts, graphs, and maps, using artificial intelligence technologies. This advanced technique leverages AI algorithms and machine learning models to automatically interpret, transform, and display data in a more understandable and insightful manner.
AI data visualization enhances traditional data visualization by providing deeper analysis, identifying patterns, and generating predictive insights with minimal human intervention. It empowers users to make data-driven decisions by offering clear, interactive, and dynamic visual representations of data trends and correlations.
AI Algorithms for Data Visualization
Artificial intelligence models can be classified into three types: NLP (natural language processing), computer vision (for interpreting visual information), and machine learning (which includes predictive modeling and pattern recognition).
Interpreting language, processing and visualizing data is not exactly a piece of cake – it requires heavy usage of all the available model types.
AI data visualization leverages artificial intelligence algorithms to create dynamic and interactive representations of data – different types of charts, tables and graphs.
How could AI Data Visualizations change the world?
Data visualization is an extremely powerful tool used in all areas, from engineering to manufacturing to business and marketing. Data analytics (and, by extension, data visualization) allows businesses to make data-driven decisions.
There are no public AI tools which are able to achieve this with a 100% of accuracy just yet, but in the coming years (or even months), AI algorithms will be able to detect patterns and trends, gather insights from complex datasets, and present them beautifully.
Are you aware of the rapid pace at which the volume of data available worldwide is growing? Analysts project that by 2028, the global data volume will reach over 394 zettabytes (394 billion terabytes). While only a small fraction of this data is stored—approximately 2% in 2020. This trend is also on the rise due to increasingly advanced data storage capabilities.

How is AI used in data science?
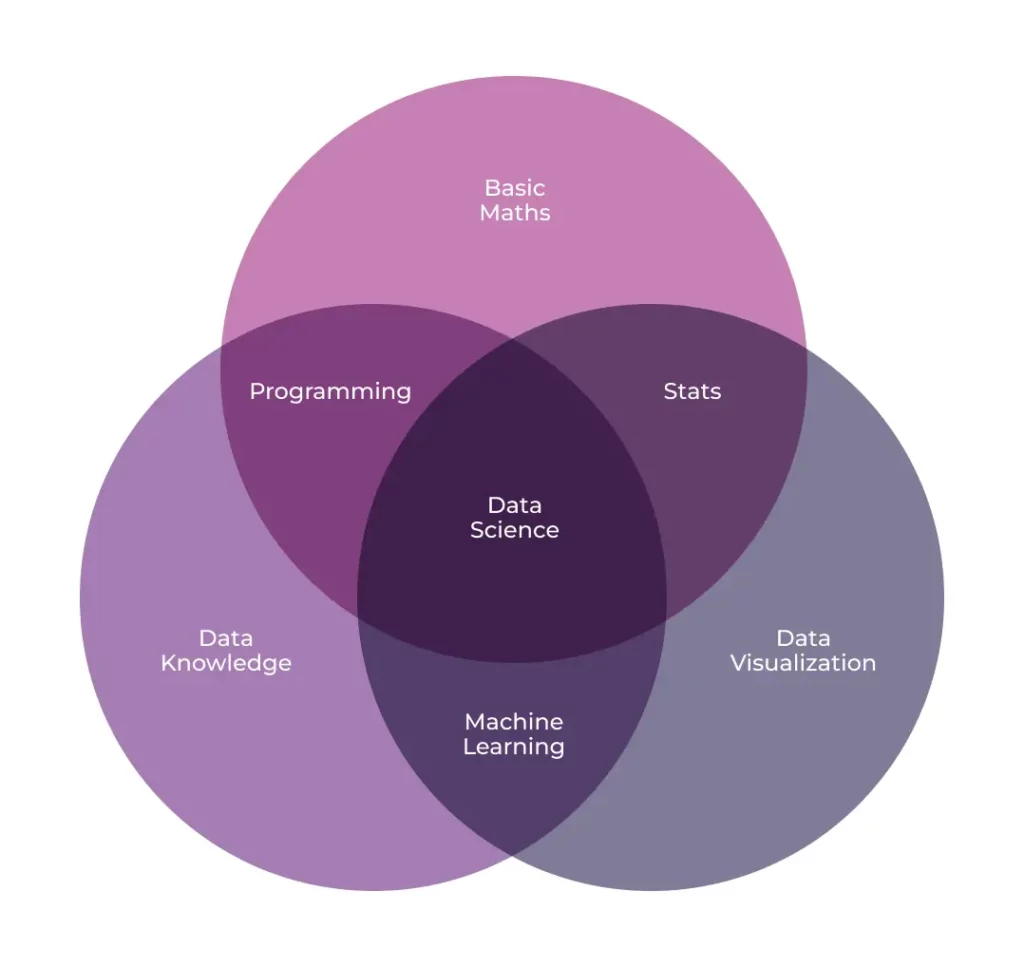
Data visualization is one of the many parts of data science, but a very important one – it acts as a bridge between complex analysis and human beings.
Data Science is the interdisciplinary field that uses scientific methods, algorithms, and systems to extract knowledge and insights from structured and unstructured data.
AI in Data Science
AI has not yet replaced human beings, BUT it has drastically changed the market. It allows people to work much more efficiently.
Data Visualization & Data Science
AI algorithms can handle vast amounts of data, often more efficiently than traditional methods. They can quickly sift through large datasets, identify patterns, and highlight significant insights without human intervention.
“Data science is the study of data to extract meaningful insights for business.”
The “automation” of data processing allows businesses to make timely data-driven decisions.
Not only can we automate data-related processes with AI, but we can also try to predict the future.
By leveraging ML models, AI can predict future outcomes based on historical data and current trends.
Specific Tools That Use AI
Any software company which has not implemented AI yet is falling behind. Most data-related software has already integrated AI into its applications.
- Tableau has introduced the “Ask Data” feature for natural language queries. This allows you to query, process, and visualize data just by using natural language.
- Power BI has introduced a similar feature – “Power BI Q&A”.
- Highcharts has introduced Highcharts GPT which allows for the GPT-based and simplified creation of Highcharts configuration code.
- We could go on and on – the same is true for Google Data Studio, IBM Watson Analytics, Qlik Sense, Domo, Sisense, or Looker.
Common Challenges in AI Data Visualization
Any change to the existing system design can mean complications at the initial stage of implementation to bring great benefits in the long run. What AI dataviz implementation issues to watch out for?
Data Privacy & Security
For the vast majority of applications, data is highly sensitive. As AI systems analyze and visualize complex datasets, they often process personally identifiable information (PII) and proprietary business data.
Ensuring that this data remains secure from breaches and unauthorized access is paramount.
There are data anonymization/encryption techniques to safeguard privacy, but they can be complex to implement effectively.
For this reason, big companies often prefer to implement their own internal AI solutions or self-hosting a certain AI model.
The Costs of Implementation – Skills & Team
Implementing a custom internal AI solution (for dataviz or not) requires significant costs and skilled personnel. The initial investment in advanced hardware and software infrastructure can be substantial, and maintaining these systems involves continuous expenditure.
Additionally, developing and deploying sophisticated AI models requires highly skilled data scientists and engineers, who are in high demand and command premium salaries.
These factors make the cost of implementation and team training a significant challenge for organizations looking to leverage AI for data visualization, particularly for smaller companies with limited budgets.
Challenges for Solo Developers
Up until now, we’ve listed common challenges in AI data visualization for companies. How about for solo or independent developers?
- Data Quality Issues: AI data visualization tools are only as good as the data they work with. Poor data quality, such as inaccuracies or incomplete datasets, can lead to misleading visualizations and insights.
- Cost & Licensing: Many advanced AI data visualization tools come with high costs or complicated licensing agreements, which can be challenging for solo developers working on and to limited budgets.
- Limited Customization: Some ready-to-go tools (not custom models for your use case) may offer limited options for customization, making it difficult to tailor visualizations to specific needs or preferences.
- Learning Curve: The list of the best available tools probably changes every week. AI is rapidly evolving and you need to keep up to date if you want to be competitive. Studying each of the new tools and comparing them with the current solution requires both time and effort.
Practical Examples of AI Data Visualizations
- Market Trend Analysis in Finance – Artificial Intelligence can process massive stock market datasets and visualize price patterns, market sentiment, or forecasts based on historical trends. An example is using heatmaps to analyze market volatility.
- Personalized Dashboards in Marketing – AI algorithms can analyze user behavior on websites and generate interactive dashboards displaying key metrics such as conversion rates, time spent on pages, and traffic sources.
- Energy Consumption Prediction in Smart Cities – AI processes data from IoT sensors and creates dynamic heatmaps showing energy consumption patterns across different city areas, helping optimize infrastructure.
- Medical Analysis Visualization – In diagnostics, AI can process data from CT scans or MRIs and generate interactive 3D visualizations of patients’ organs, assisting doctors in detecting diseases.
Summary – What is the Black Label‘s Approach to AI-powered Dataviz Solutions?
We have explored the transformative role of AI in data visualization, highlighting how advancements in computational power and data accumulation have enabled the development of AI models that can process and visualize vast amounts of data efficiently. We have also addressed some concerns related to privacy, security and costs of implementation and tried to envision a future where AI-driven data visualization becomes even more powerful.
At Black Label, we believe that a proper understanding of the possibilities offered by artificial intelligence determines long-term success. While we use AI in our daily work, we see it as more of a complement to a product rather than a standalone solution at this stage. Perhaps, over the years, AI will become infallible, but for now, it still requires human oversight.
We help people make better data-driven decisions.
Don’t hesitate to schedule a free consultation. We’ll be happy to advise you on the best data visualization solutions for your business.