

Until recently, a chart was just an image. Created in Excel, added to a report, pasted into a presentation – from a computer’s perspective, it was just a collection of pixels without any meaning. Today, things are changing. Thanks to advances in computer vision, machines can now look at a chart and… understand it. They can read values, recognize axes, and identify chart types. Just like a human – but faster. This is reverse dataviz: extracting data from existing visualizations. Instead of transforming data into images, we go backwards – turning images back into data.
This is not the future, but the present – a technology already reshaping how we work with visual information.
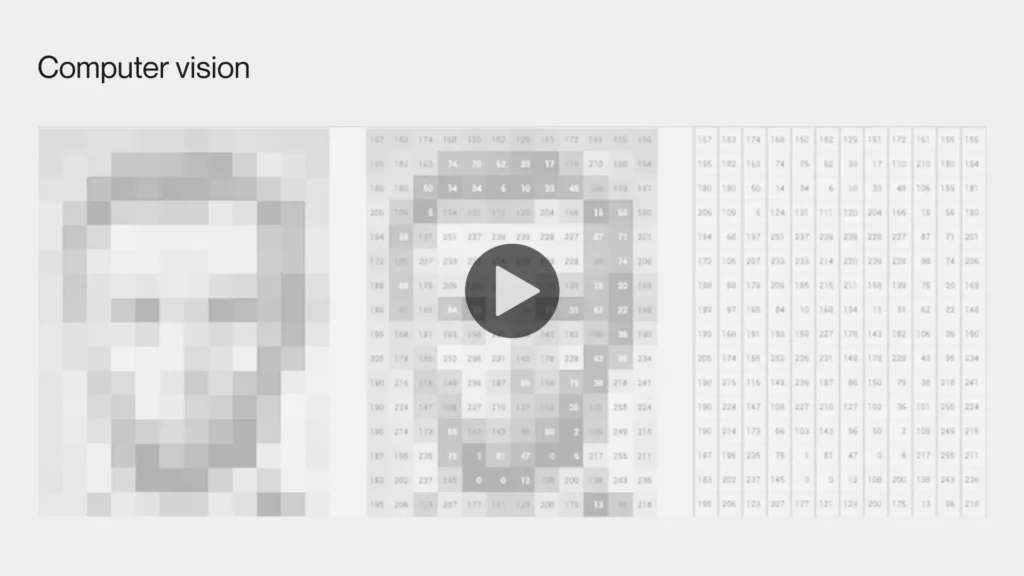
What Is Computer Vision?
Computer vision is a field of artificial intelligence that enables machines to interpret and understand visual information, such as images and videos. It helps identify objects, recognize faces, read handwritten notes, or detect products in stores. Everyday uses include, among others, smartphone cameras, social media filters, and smart home security systems.
From Simple Images to Deep Learning – A Brief History of Computer Vision
The Birth of Computer Vision: Experiments and Early Algorithms
Computer vision began in the 1960s when AI researchers tried to teach machines to see like humans. Early projects connected cameras to computers to “describe” images, revealing the task’s complexity. Algorithms for edge detection, line labeling, and 3D modeling soon followed, treating images as sources of structural scene information rather than just pixels.
Development of Mathematical Tools and Practical Applications
In the 1980s and 1990s, mathematical foundations advanced with scale-space analysis, contour models, and shape reconstruction from shading and texture. Optimization and probabilistic methods improved accuracy. Face recognition and graph-based image segmentation emerged, while computer vision and graphics converged, enabling rendering, morphing, and panoramic stitching.
The Deep Learning Revolution and New Capabilities
The breakthrough came in 2012 when AlexNet’s success in ImageNet showed deep learning’s power. Since then, CNNs and vision transformers have improved classification, segmentation, and detection. Today, computer vision enables automatic image analysis, pattern recognition, visual captioning, and AI integration, greatly expanding visual data processing.
Reverse Dataviz – Z to A Instead of A to Z
By default, we create charts from data, but reverse dataviz works the other way around – a computer analyzes a chart image and reconstructs the data. How does it work? First, the system:
- Identifies the chart type, e.g., bar, pie, or line chart.
- Detects axes, labels, legends, and individual data points.
- Recognizes text and numbers on the chart using OCR technology.
- Converts the positions and sizes of graphic elements into numeric values.
This technology is especially useful when the original source data is unavailable – for example, in scanned reports, academic publications, or screenshots. Where an analyst might spend several minutes estimating values manually, a computer vision model can do this in seconds, providing greater accuracy and saving time. This automation significantly speeds up data extraction workflows and reduces human error, making it ideal for large-scale analysis or quick decision-making.

A Wealth of Technologies Behind Reverse Dataviz
Reverse dataviz combines multiple technologies:
- OCR (Optical Character Recognition) – tools like Tesseract or Google Vision recognize text on axes and labels.
- Image Segmentation – CNN models separate the chart from the background and identify elements.
- Chart Type Classification – CNN or Vision Transformers determine the chart type.
- Data Reconstruction – algorithms convert graphic element positions and lengths into numeric values.
- Preprocessing – image enhancement, noise reduction, and binarization to improve OCR and classification accuracy.
It’s not just “reading the chart.” It’s interpreting the logic behind the image.
The Maze of Challenges – AI limitations in Chart Analysis
This all sounds great, but it’s not easy. Computer vision for reverse dataviz faces many obstacles:
- A Variety of Charts – dozens of types, layouts, and styles.
- Image Quality – blurring, compression, low-quality scans.
- Visual Noise – watermarks, backgrounds, interference.
- OCR Problems – unusual fonts, rotated text, vertical numbers.
- Non-intuitive Styles – creative infographics, custom layouts.
A chart is not just graphics – it’s a data structure dressed in visual form. The machine must not only understand what it is seeing, but also what it means.
Reverse Dataviz in Practice – Real-World Applications
Reverse dataviz is already working and delivering results:
- Competitive Analysis – companies extract data from competitors’ reports and presentations.
- Scientific Research – automatic chart reading speeds up secondary data analysis.
- Media and Trend Monitoring – charts in news articles become data sources for analysis.
- Internal Software Tools – for example, validating generated charts or converting old images to data.
An interesting case? Converting old scientific publications into tabular data – thousands of charts gaining new life.
Fun Fact: Computer vision systems can recognize images even when objects are camouflaged or partially hidden, for example, algorithms can identify items in drone images despite poor weather, damaged, or blurred sections. This is thanks to machine learning, which “fills in the gaps” like the human brain does when perceiving incomplete information.
Want to Extract Data out of a Chart? Here’s How:
If you want to try reverse dataviz yourself, you don’t need to build AI models from scratch. Here are a few simple steps to get started:
- Take a clean screenshot of the chart – the better the image quality, the easier the extraction. Avoid blurs and unnecessary decorations.
- Use OCR tools – free options like Tesseract or Google Vision API (free tier) to recognize text, numbers, and labels on the chart.
- Use image analysis libraries – OpenCV helps extract axes, lines, and data points via segmentation and shape detection.
- Try ready-made tools – apps like PlotDigitizer or WebPlotDigitizer let you manually or semi-automatically convert charts into data.
- Verify results – compare extracted values with the original chart to correct any mistakes.
Curiosity: If you are interested, you can experiment with CNN or Vision Transformer models to teach algorithms chart recognition and automate the process. Reverse dataviz is an exciting field increasingly accessible to individual analysts.
The Future of Reverse Dataviz and Computer Vision
What’s coming next? The field is evolving fast, with key advancements that will make extracting data from charts easier and more accurate:
- Improved AI Models – multimodal systems combining image and text analysis will better understand complex charts by linking visual elements with their descriptions.
- NLP & Computer Vision Integration – by interpreting chart captions and legends alongside images, AI will gain deeper context, reducing errors and ambiguities.
- Specialized Pipelines – custom-trained models for specific industries like finance, healthcare, or marketing will deliver tailored extraction, handling unique chart types and conventions.
- Growing Open-Source Ecosystem – tools such as ChartOCR, PlotQA, and AI2D-RST make advanced chart data extraction accessible to more users and encourage innovation.
- Real-Time Automation – soon, taking a simple screenshot of any chart could instantly return clean, usable data – transforming workflows and speeding up analysis.
The big picture? These advances mean analysts and data scientists will spend less time manually decoding visuals and more time using the insights they contain, with AI doing the heavy lifting of understanding complex visualizations.
Summary – Pixels into Truth
Computer vision today is not just about face or car detection. It’s about understanding charts and turning them into data. Reverse dataviz transforms static images into living knowledge sources.
Though still challenging, these technologies mature quickly. For data analysis and visualization teams, this means a new quality of work and a competitive advantage. So next time you look at a chart, remember: behind those pixels might already be an algorithm seeing data just like you – or maybe even better.
No matter which direction computer vision takes, one thing is certain – from now on, the abbreviation ‘CV’ will no longer make you think of a curriculum vitae.