
Have you ever looked at a mountain range stretching across the horizon — some peaks are jagged while others are gentle, and thought: “This looks a bit like my website traffic last month”? Okay, maybe not exactly that. But there’s a reason why the visual of rising and falling slopes feels so familiar when analyzing data. Peaks and valleys tell a story — and sometimes, all it takes is the right type of chart to make that story clear. In this article, we’ll explore how an area chart can help you visualize change, reveal trends, and make your data as readable as a mountain silhouette at sunrise.
What is an Area Chart?
An area chart is a type of graph that displays quantitative data over time. It looks like a line chart, but with the space beneath the line filled in to highlight magnitude. This makes it ideal for showing trends and cumulative totals, such as visualizing monthly website visits by traffic source.
Key features:
- emphasizes volume under the line,
- helps show change and growth over time,
- supports single or multiple data series (stacked or overlapping),
- easy to read and visually engaging.
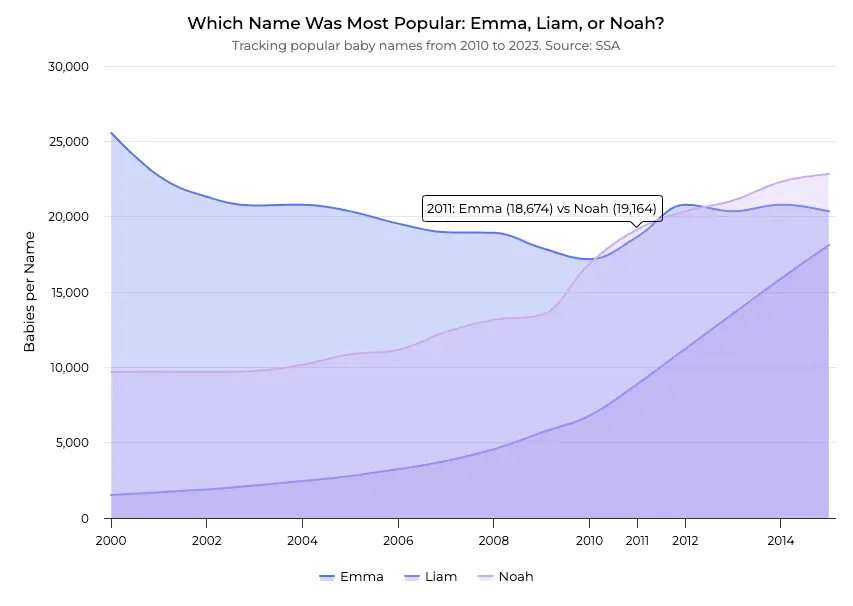
The fluctuating trends in the popularity of baby names Emma, Liam, and Noah between 2000 and 2014 – source.
Fill the Space with Data – How the Area Chart Works
Area charts are especially useful when you’re tracking data over time and want to highlight not just the direction of change, but its magnitude. The filled space beneath the line creates a strong visual sense of volume, which makes it easier to grasp how much value has changed and how different categories contribute to a whole. They work well for showing cumulative figures like revenue, user growth, or expenses, and are commonly used in business for tracking sales performance, website traffic sources, market share shifts, project budgets, or social media engagement over a campaign period.
These charts are most effective when the goal is to communicate trends, accumulation, or category contributions in a visually intuitive way. However, if your dataset contains many overlapping series or requires precise value comparisons, other chart types like line or bar charts may be a better fit.
Area Chart Examples
While area charts aren’t the most complex dataviz format, they come in several variations — each suited to different types of analysis. What sets them apart are subtle design choices: how the curves flow, how layers stack, and how color guides the interpretation.
In the next sections, we’ll cover the most common types, show how they work, and help you choose the right one for your data.
Spline Area Chart
This variation uses smooth curves rather than straight lines to connect data points, resulting in a more fluid and elegant graph. It’s particularly effective when gradual change is more meaningful than abrupt shifts.
Best for:
- financial reporting with smooth trends,
- economic forecasting with gradual change,
- situations where sharp angles hinder interpretation,
- presentations emphasizing aesthetics and readability.
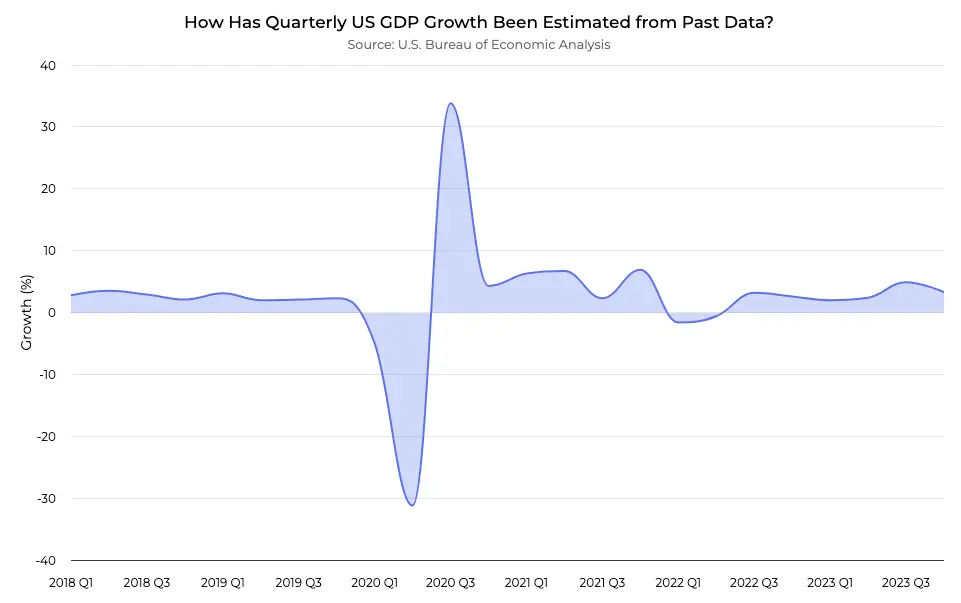
Quarterly growth of the US GDP – an estimation from the not-so-distant past – source.
Area Range Chart
Displays both minimum and maximum values over time, creating a band to represent variability. It communicates uncertainty or fluctuation effectively.
Best for:
- showing prediction intervals or confidence bands,
- visualizing temperature ranges, performance variability, or tolerances,
- forecasting models with inherent uncertainty,
- scientific data where ranges matter more than averages.
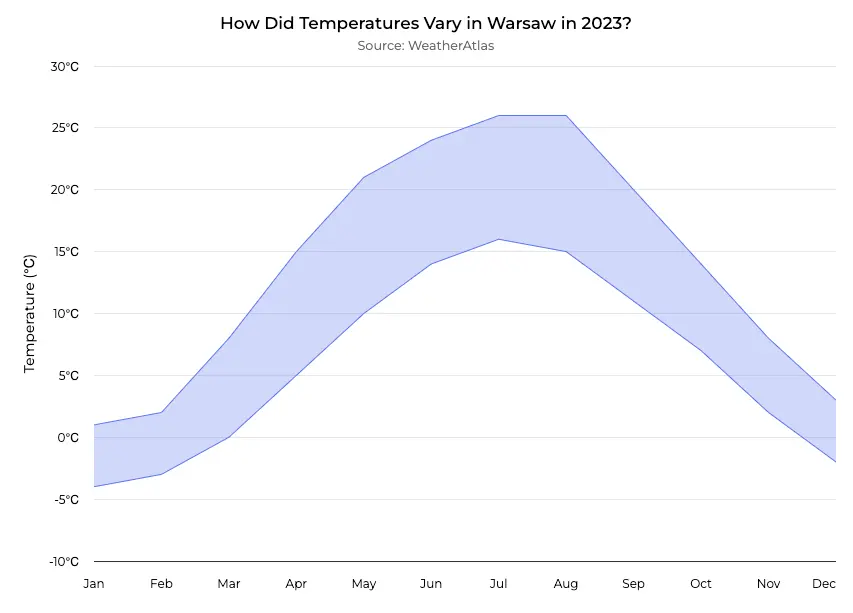
How’s the weather in your area? This blue band depicts the monthly temperature fluctuations in Warsaw, Poland, throughout 2023 – source.
Streamgraph
Uses flowing, organic shapes to visualize multiple datasets around a central axis. It emphasizes the rhythm and motion of data over time.
Best for:
- comparing trends across multiple categories,
- storytelling with data (e.g., in journalism),
- showing musical trends, media consumption, or thematic flows,
- visualizing seasonal or cyclical behavior in an engaging way.
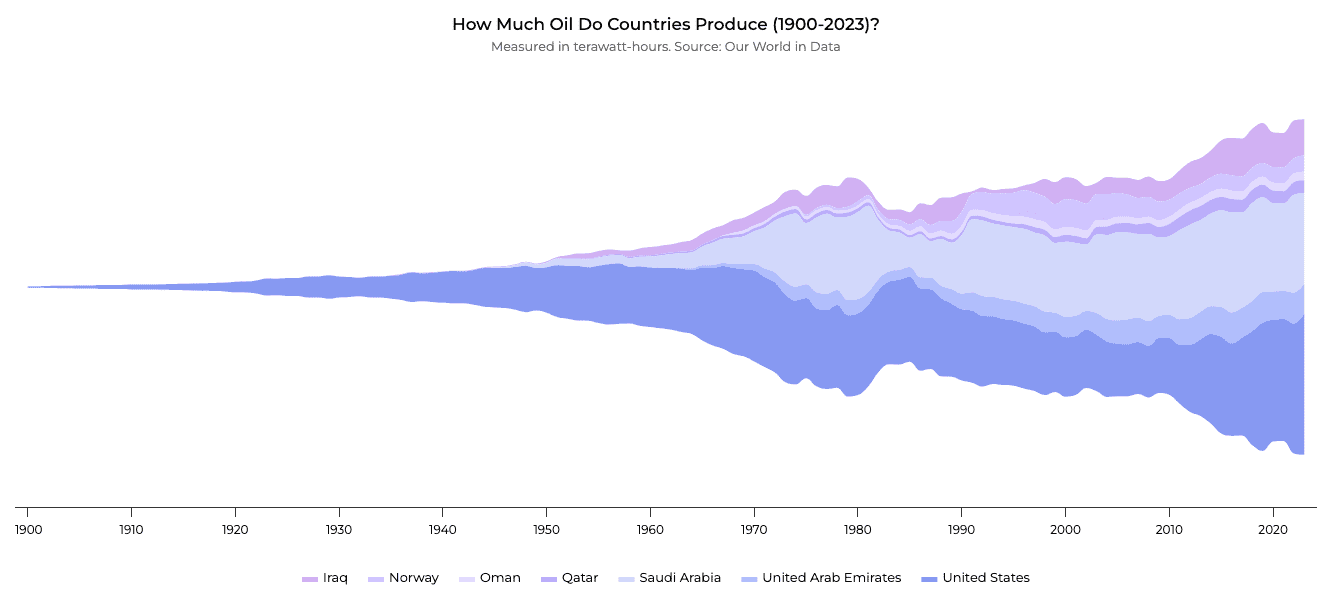
This slick oil chart shows production trends of the major oil-producing countries across the globe from 1900 to 2023 – source.
Reference Chart
Not a chart type but rather an enhancement. It layers in reference lines or shaded zones to offer benchmarks or context alongside main data.
Best for:
- highlighting targets, thresholds, or norms,
- comparing actual vs. expected performance,
- showing policy limits, KPIs, or compliance zones,
- making dashboards more actionable and interpretable.
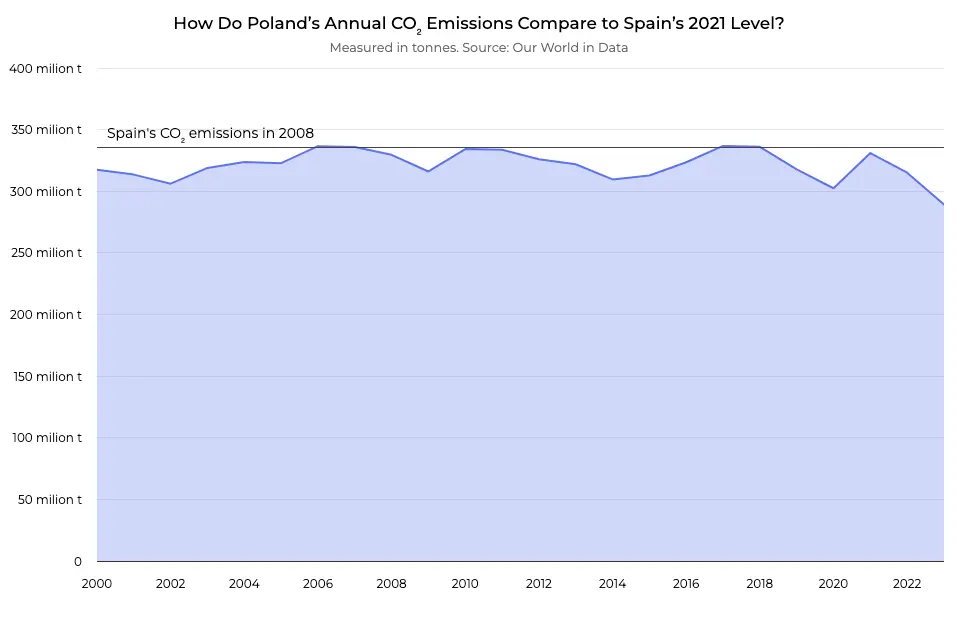
A comparison of Poland’s CO2 emissions with Spain’s emission level in 2008 between 2000 and 2022 – source.
Stacked Area Chart
Multiple series are stacked to form a composite shape, useful for showing both individual contributions and the total sum.
Best for:
- tracking category contributions over time (e.g., departments, sources),
- comparing overall trends with individual breakdowns,
- cumulative metrics like sales, budget, or traffic sources,
- proportion analysis (when the total is represented as 100%).
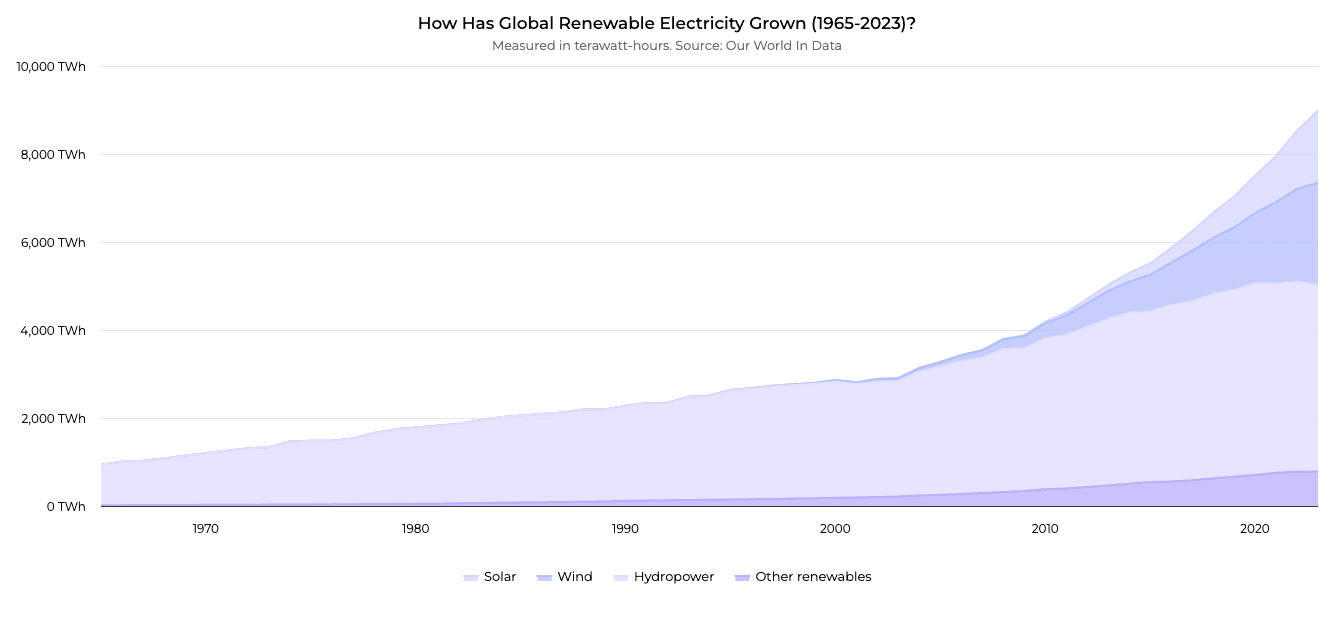
The growth of global renewable electricity production between 1965 and 2023 – source.
Area Chart vs Area Graph – the Differences
Although these terms are often used interchangeably, there are slight distinctions worth understanding. “Area chart” is the more formal term used in most business intelligence tools and data platforms, referring specifically to the filled-line graph structure. “Area graph,” on the other hand, is more general and can refer to any visual using filled space to represent data. When speaking to a technical audience or designing formal reports, using a specific term can help ensure clarity.
6 Tips for Creating an Area Chart
Here are some best practices for working with this visualization style:
- Be cautious with negative values: Since the filled space implies accumulation, negative numbers can mislead. Consider adjusting the axis or switching formats if negative values dominate.
- Handle gaps in the data: Missing values can break the visual flow. Decide whether to interpolate, exclude, or insert placeholders depending on the context.
- Use color strategically: Limit your palette to improve readability. Ensure it remains accessible for colorblind viewers.
- Keep it clean: Too many overlapping series can clutter the display. Simplify where needed or consider stacking.
- Think in proportions when relevant: A percentage-based layout can highlight relative differences, but may obscure the absolute scale.
- Label clearly, but sparingly: Annotations and axis labels add value, as long as they don’t overwhelm the chart.
Conclusion – Data That Flows
Area charts are more than just filled-in graphs — they’re a storytelling tool for showing rises, falls, and how individual parts contribute to the bigger picture. With flowing lines and shaded regions, they don’t just reveal the direction of change, but also its magnitude.
Choosing the right type of area chart depends on what you want to highlight — whether it’s smooth trends, ranges of uncertainty, or how categories stack up over time. The key is clarity and restraint: limit the number of series, use color wisely, and remember that less is often more.
A well-designed area chart can say more than a spreadsheet full of numbers. Once you understand its strengths, you’ll have a visual format that gives your data rhythm, shape, and a story your audience can actually feel.
We help people make better data-driven decisions. Contact us for a free consultation here.