
Insights Appear Directly Inside the Chart
Users get answers in the context of their data, without switching tools.
Add an AI layer to your dashboards and interfaces. Let users go from data to answers without switching tools.









We can either add AI to existing systems or design and build complete data experiences, from the presentation layer to AI interaction.
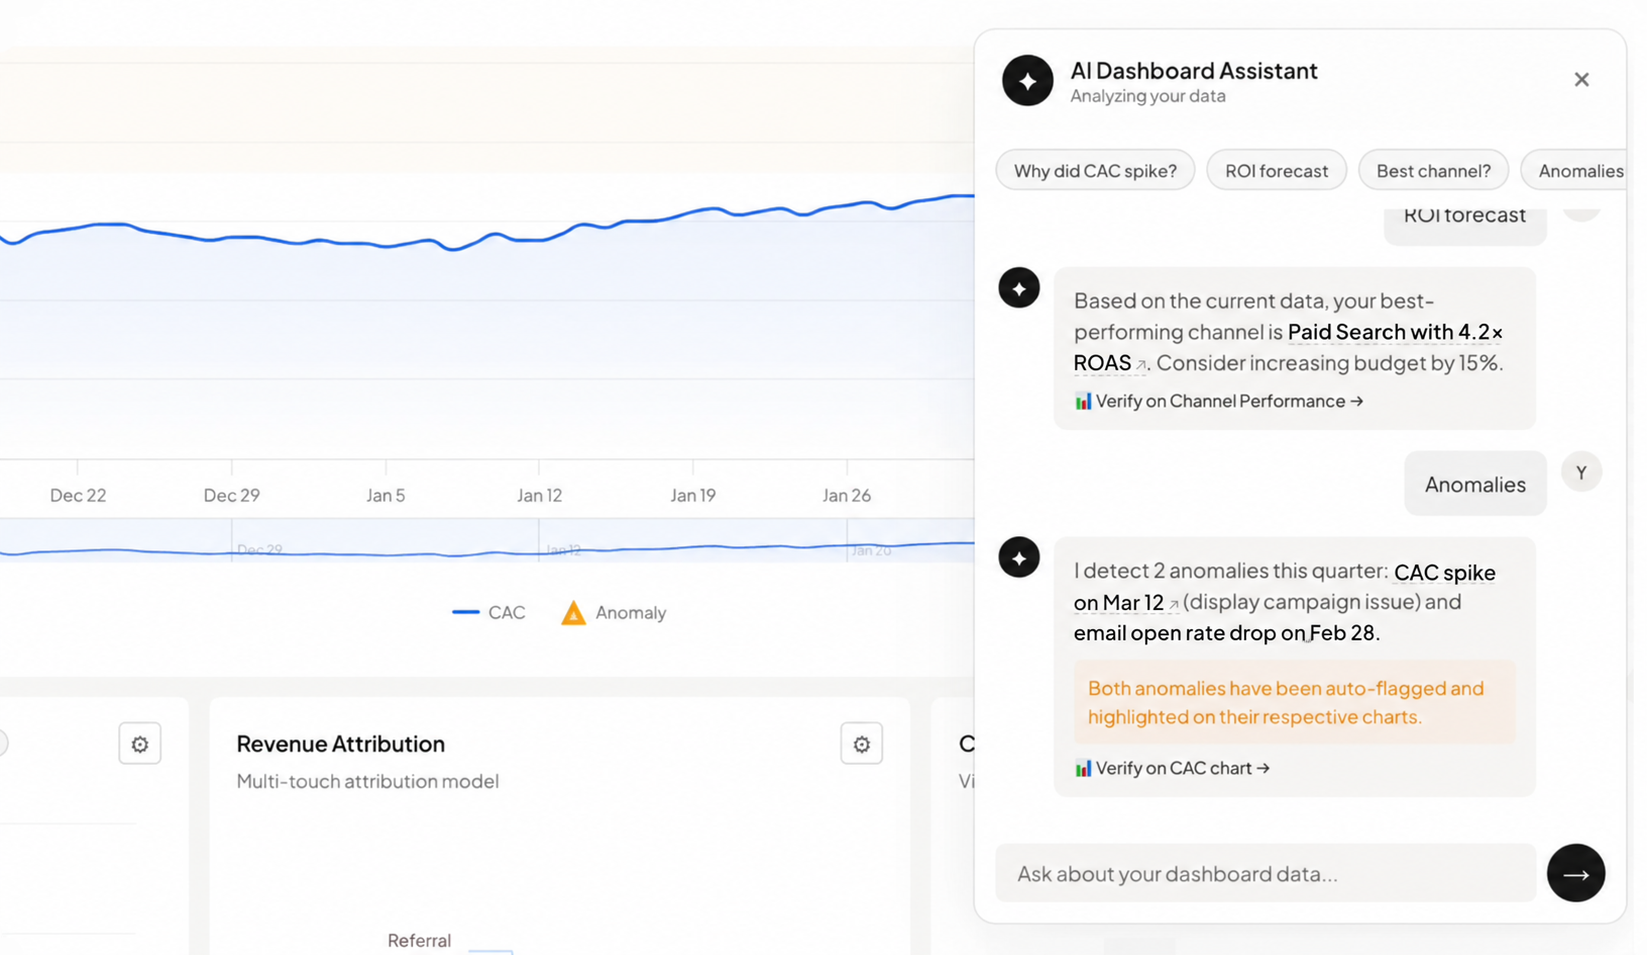
Turn raw data into clear conclusions. Users twill get the key takeaways without digging through the tnumbers.
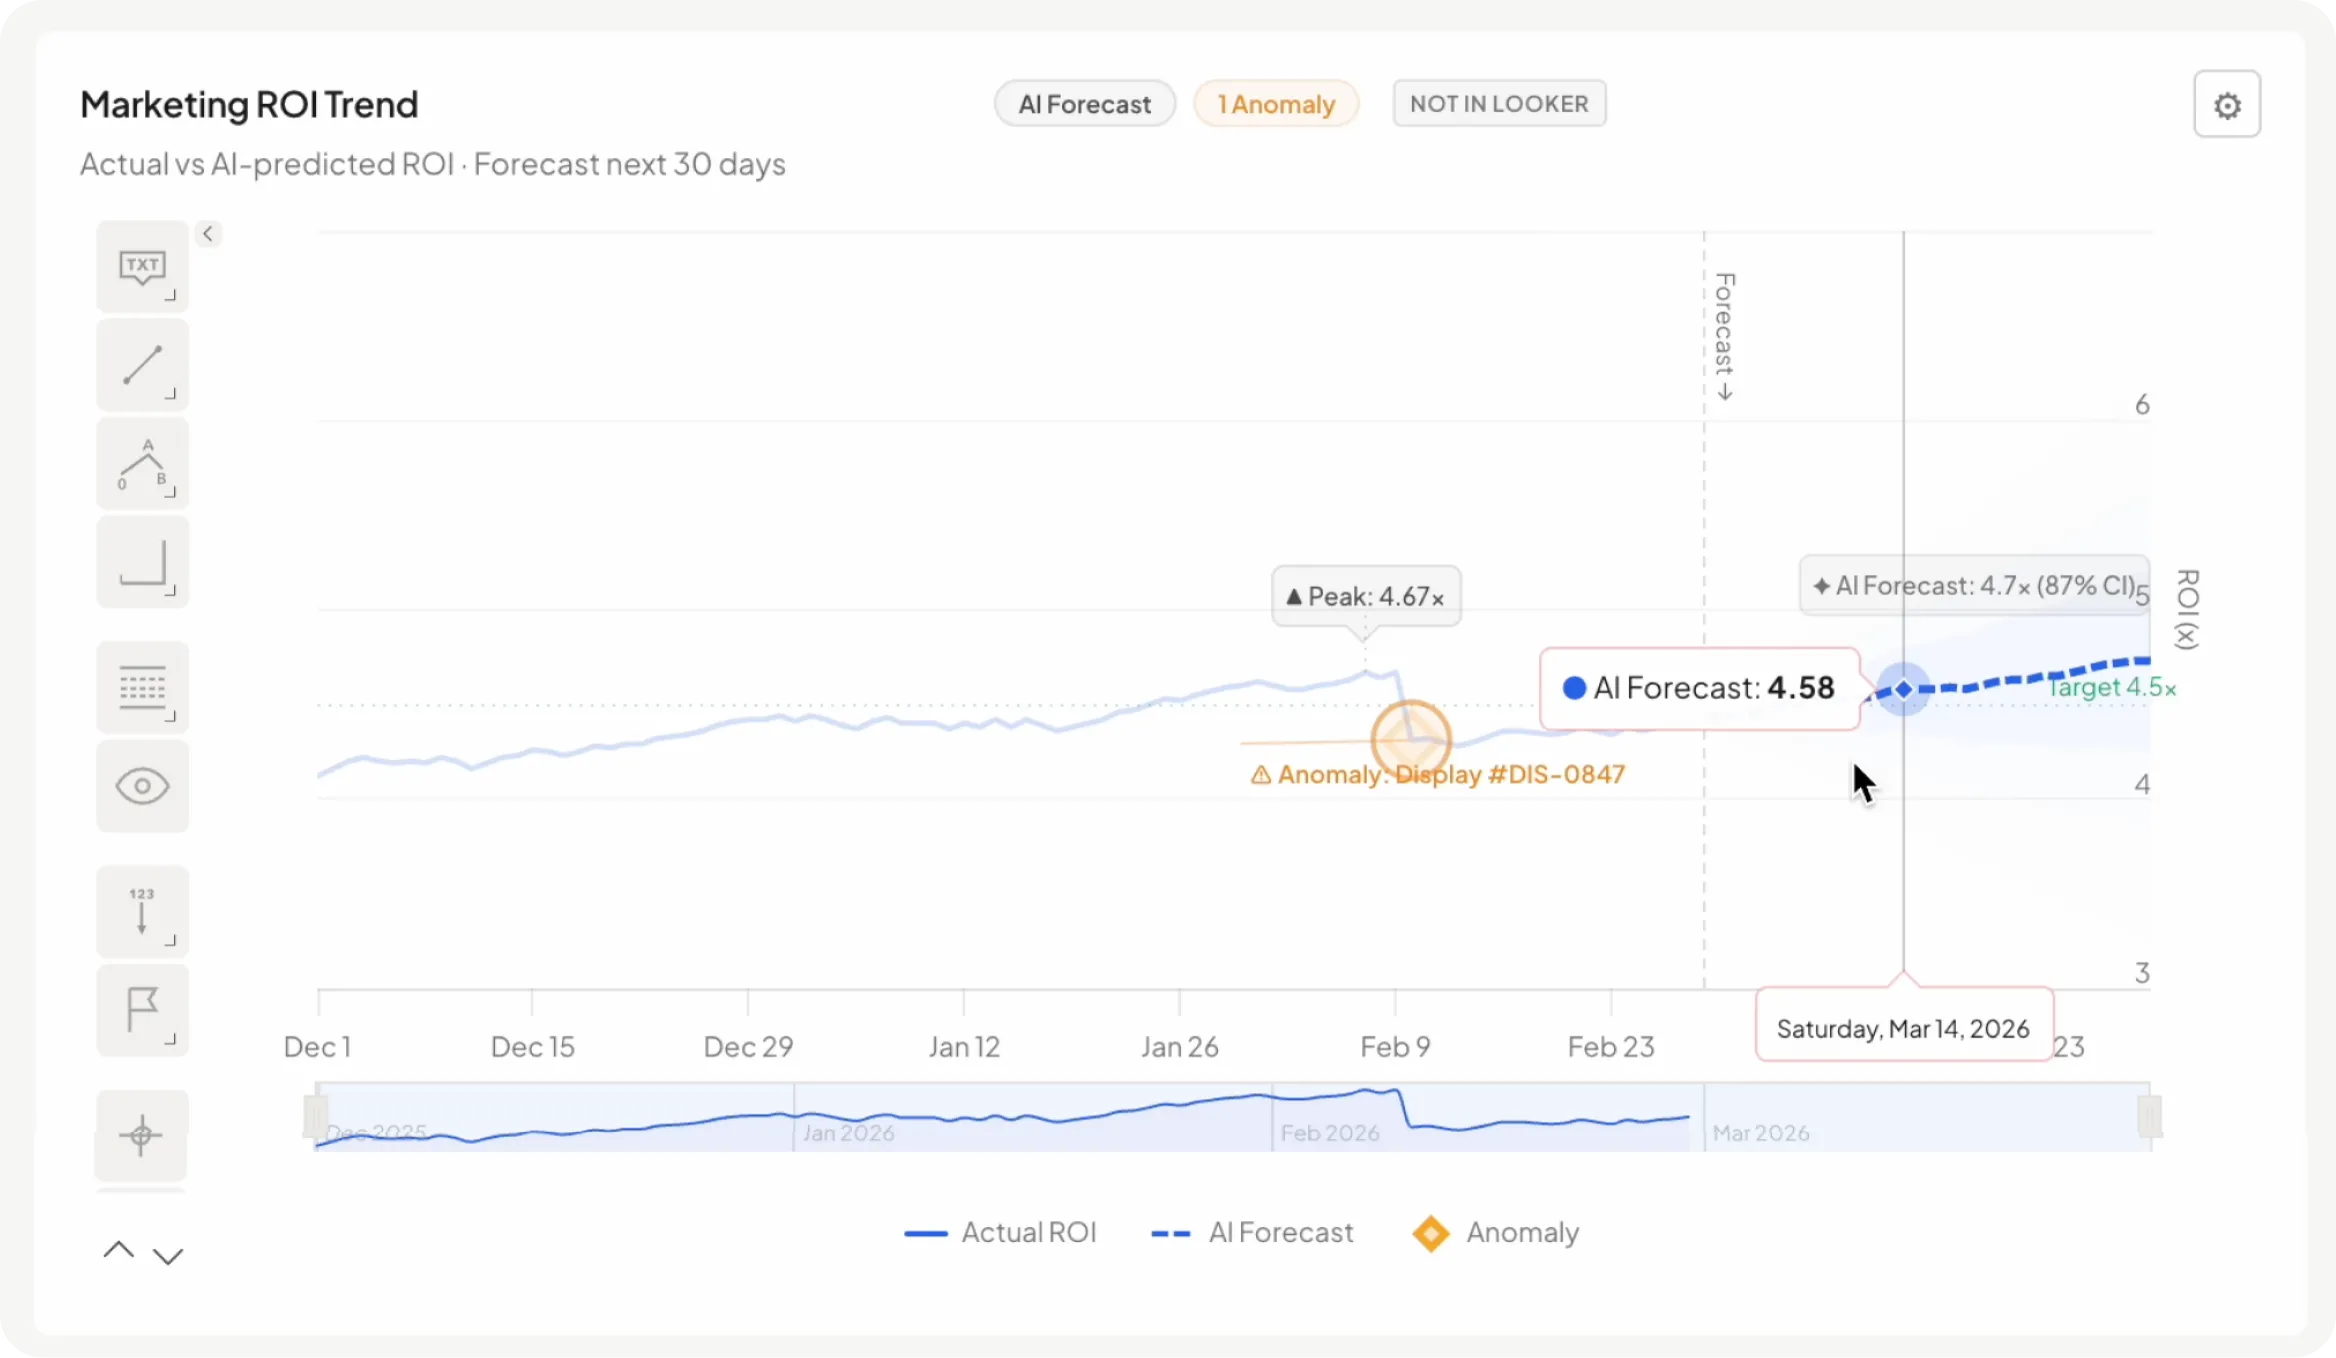
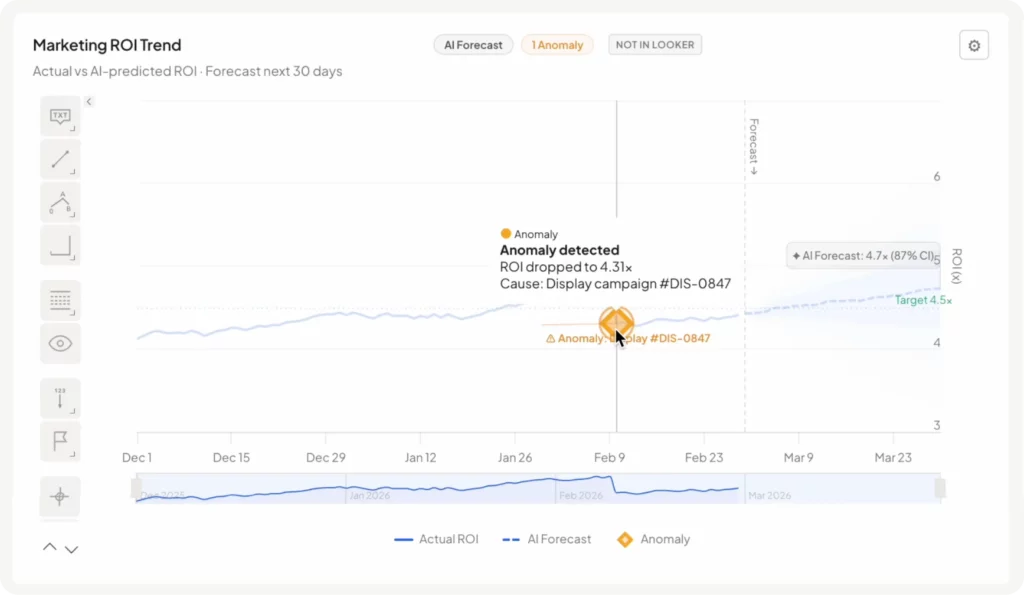
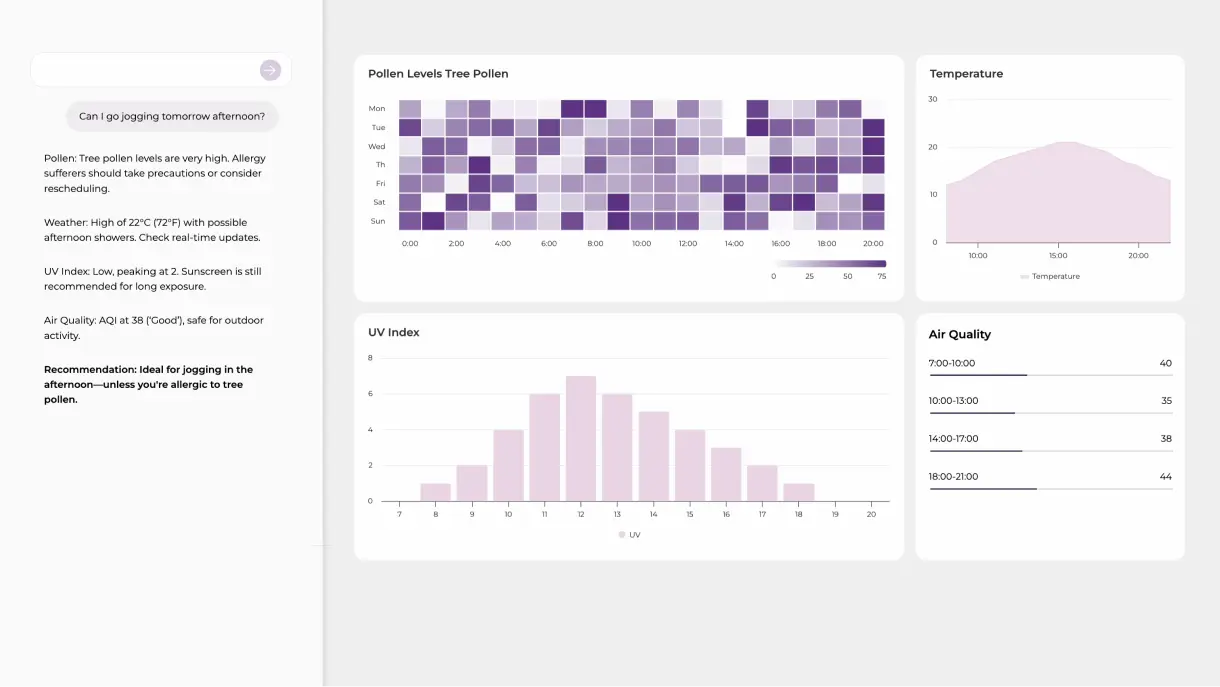
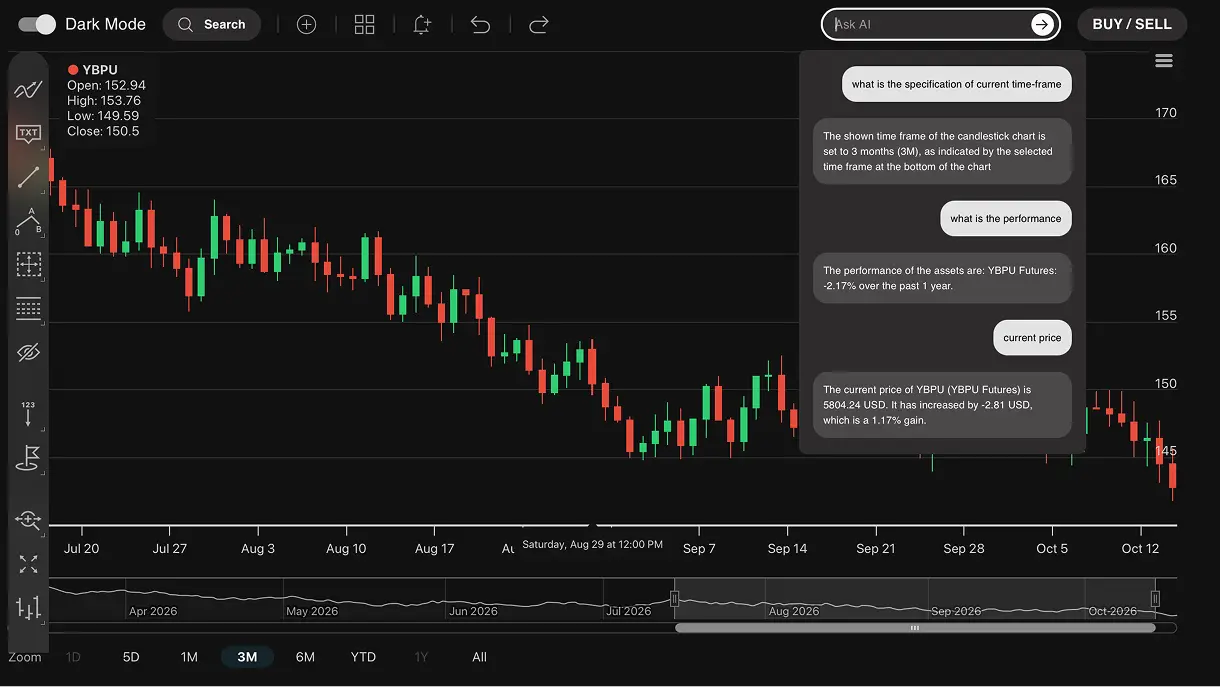
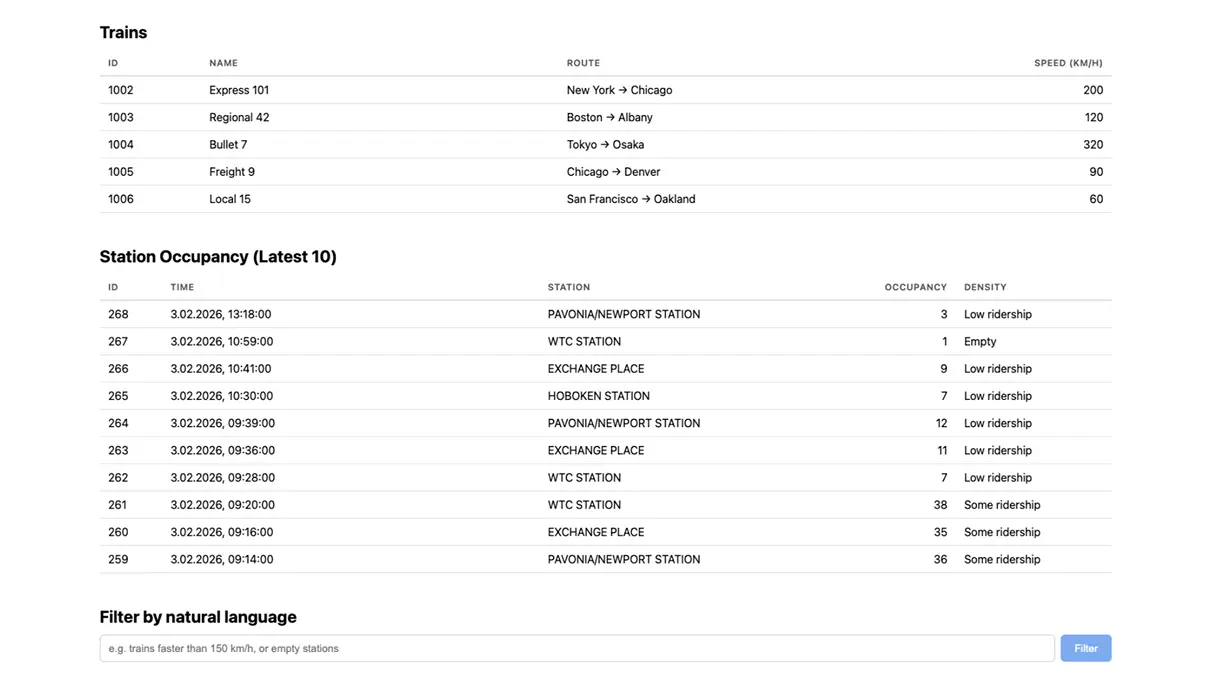
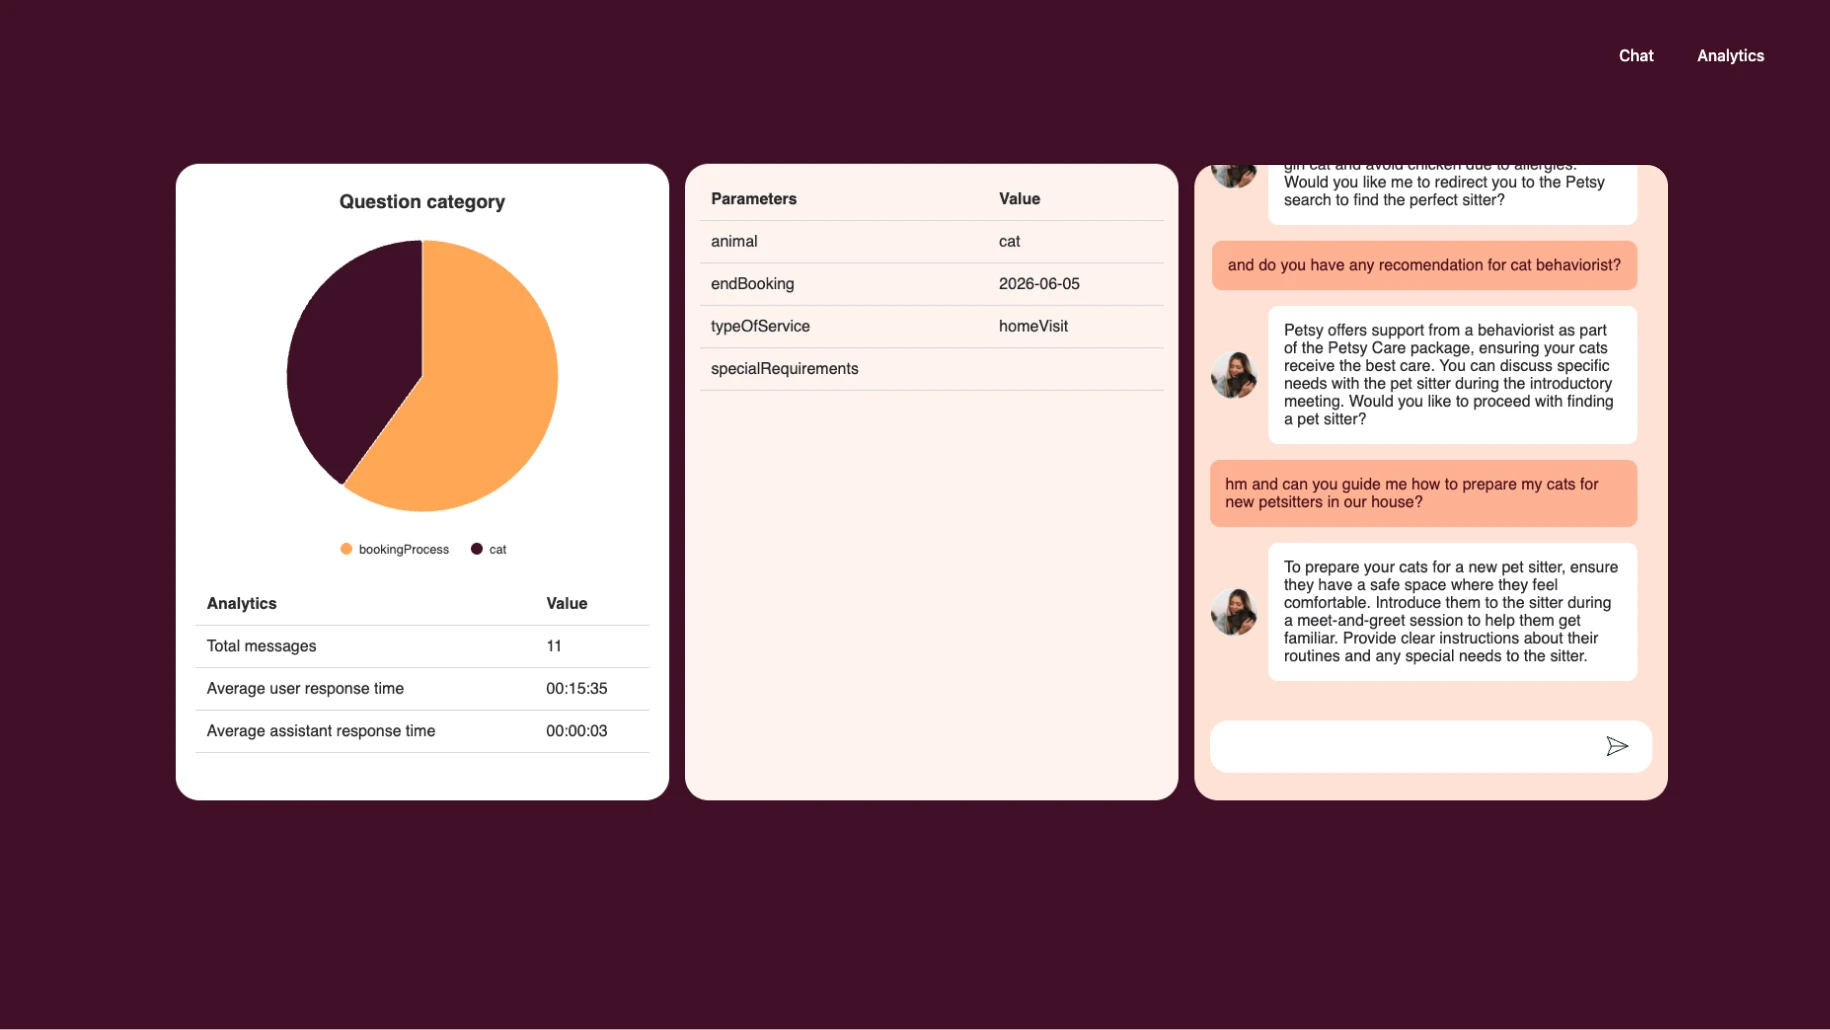
Build intuitive AI-powered interfaces and clear data visualizations that fit your existing product architecture.
Book a ConsultationUsers get answers in the context of their data, without switching tools.
People stop exporting data and find every insight they need in one place.
Even non‑technical users can explore data and build their own views.
Dashboards can be generated in seconds from a simple prompt.
As core contributors to Highcharts we have helped build a charting library used by 80 of the 100 largest companies in the world.
Users see how every conclusion was reached. They can check conversation flows, prompt evolution, and decision patterns.
Ensuring clear context, controlled data access, and reliable data improves the accuracy of every result.
Every interaction between the model and your data can be logged, monitored, and reviewed to meet regulatory requirements.
We bring data visualization expertise to AI integration, making even complex data easier to understand.



We assign the right people to your project and keep the team together over time.

We eliminate experimentation cycles and deliver working systems faster, without compromising quality.
No fragile prototypes. Every implementation is stable, scalable, and ready for real-world loads.
Design, orchestration, and interaction logic are handled on our side. Your engineers stay focused on core product development.
Every system we build ships with access control, audit logging, and accessibility compliance from day one.
Our implementations align with your architecture, coding standards, and deployment pipeline. No disruption, no rewrites.
We solve edge cases before they become blockers. You benefit from battle-tested patterns, not trial-and-error learning.

Fill out the form, and we’ll get back
to you as soon as we can.
AI‑powered data visualisation combines interactive graphs, charts, and dashboards with Large Language Models (LLMs) to automate, improve, and speed up analysis, interpretation, and explanation of complex datasets. As an addition to the charts, AI in data visualisation allows users to ask questions in natural language, detect patterns, and generate insights directly within the visual interface, along with other interaction types, like manual filtering, grouping, zooming, etc.