Extend standard charts with custom functionality, create advanced synchronization between graphs and datasets, or build complex interfaces on top of simple visualizations.


Extend standard charts with custom functionality, create advanced synchronization between graphs and datasets, or build complex interfaces on top of simple visualizations.
Build production-ready trading platforms, portfolio dashboards, and investment solutions with advanced real-time data handling.

Create map applications with custom layers, impressive animations, and big-data optimization — designed for performance and outstanding UX.

Implement industry-specific Gantt solutions for construction, manufacturing, MedTech, or PropTech with customized planning features.

Optimize dashboards for performance, live-data handling, mobile experience, and accessibility — informed by our 50+ enterprise implementations.

Build production-ready data grids and tables with editing capabilities, data validation, and large dataset optimization.

Working on a unique implementation or need expertise in specialized features? We can help you solve custom challenges across the entire Highcharts ecosystem.


No matter where you are stuck, from technical complexity to resource constraints. Our approach reduces uncertainty and gets you to production faster. Here's how we solve each challenge:
Your Highcharts implementation has grown over time. Custom features, large datasets, and early architectural choices now slow performance, increase maintenance effort, and put future scalability at risk.
Your charts become stable and future-proof. Through identifying risky custom logic and performance bottlenecks, your architecture gets redesigned for speed, maintainability, and scale. Your team ships features on schedule, not emergency fixes.
Your data comes from multiple sources-APIs, databases, legacy systems – each with different formats and update frequencies. What started as a simple integration has evolved into fragile pipelines that are hard to debug and costly to maintain, with synchronization issues and reliability problems.
Clean pipelines with predictable transformations eliminate integration friction. Your charts show accurate data consistently. Deployments stop breaking integrations. Your team focuses on building features, not debugging data flows – all without disrupting your existing systems.
Your team lacks deep Highcharts knowledge. Without clear guidance, they spend time experimenting, repeating mistakes, and debating decisions. Progress slows, and hiring full-time specialists isn’t realistic for your needs.
You work with experts who are directly involved in your codebase and run code reviews. Your team gains the skills and confidence to own Highcharts long-term with no vendor dependency.
You have a visualization concept that stakeholders want, but requirements are vague, technical feasibility is uncertain, and estimates are unreliable. Without clarity on scope, timeline, and cost, the project is stuck before it starts.
Feasibility validation and realistic scope definition give you clarity. You get transparent projections with a phased roadmap. This provides the confidence to secure executive buy-in and move forward, or save months by stopping early if it’s not worth the investment.
See how we've helped companies overcome complex challenges in customization, integration, and performance with Highcharts.
 See full Case Study
Datahaus 2025
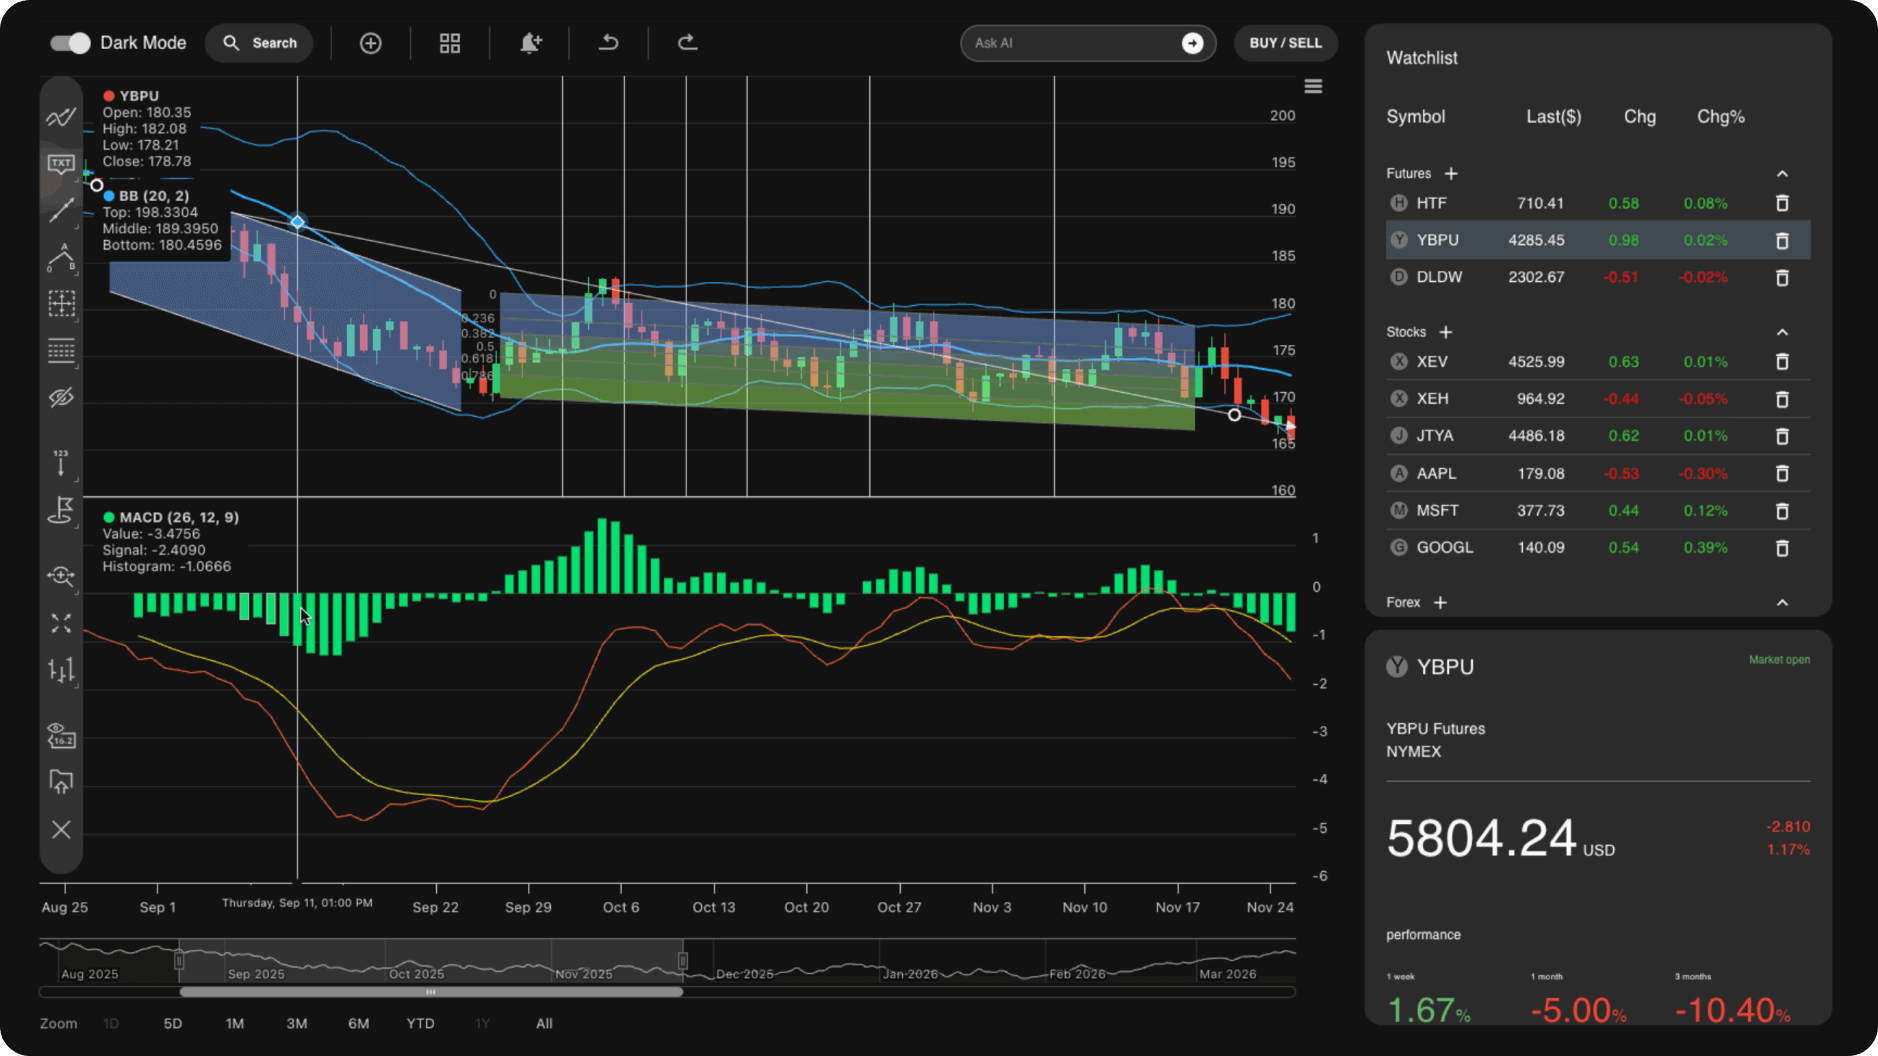
An Australian fintech needed a custom trading platform that combined TradingView functionality with crypto trading features. We built the front-end from concept to beta launch and continue as their development partner.
 See full Case Study
Wi-Tronix since 2018
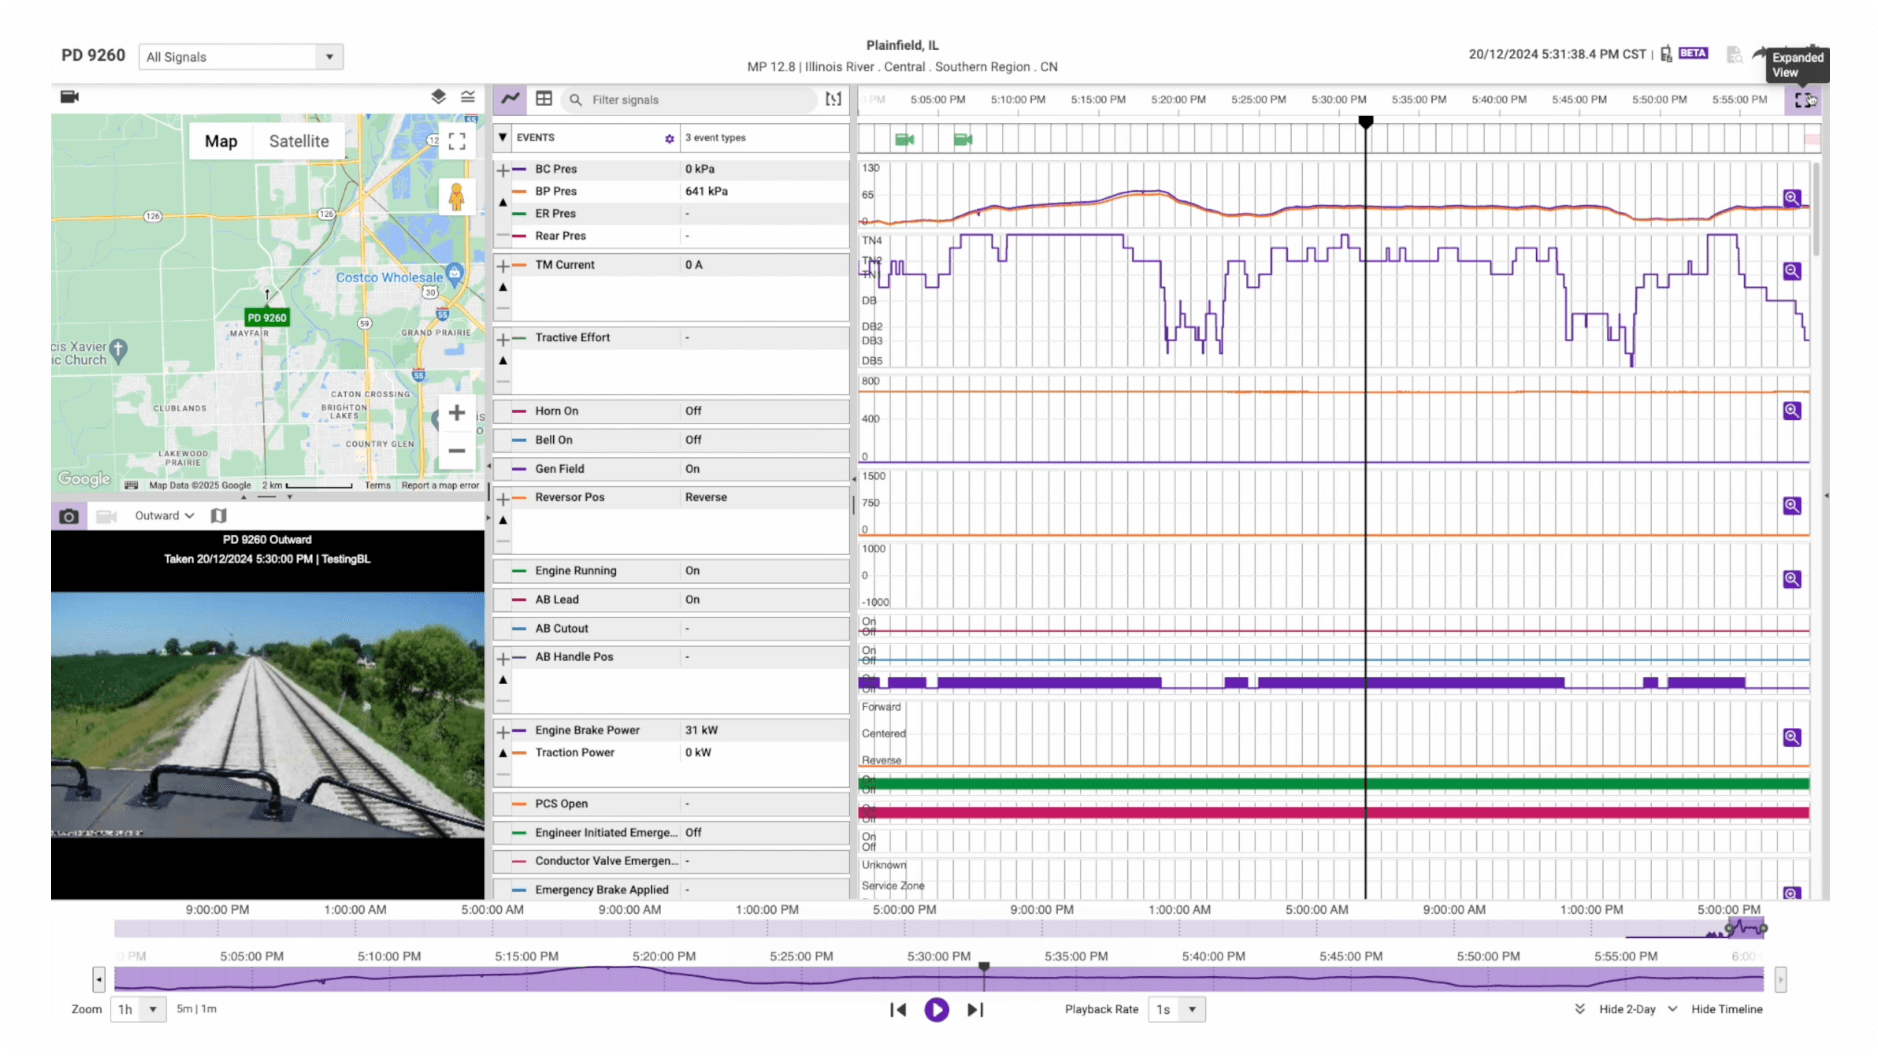
A rail monitoring platform experienced urgent performance issues with charts and maps as datasets grew. We rebuilt the entire front-end for high-volume data handling and provide ongoing dedicated team support.
 See full Case Study
Deepflare 2025
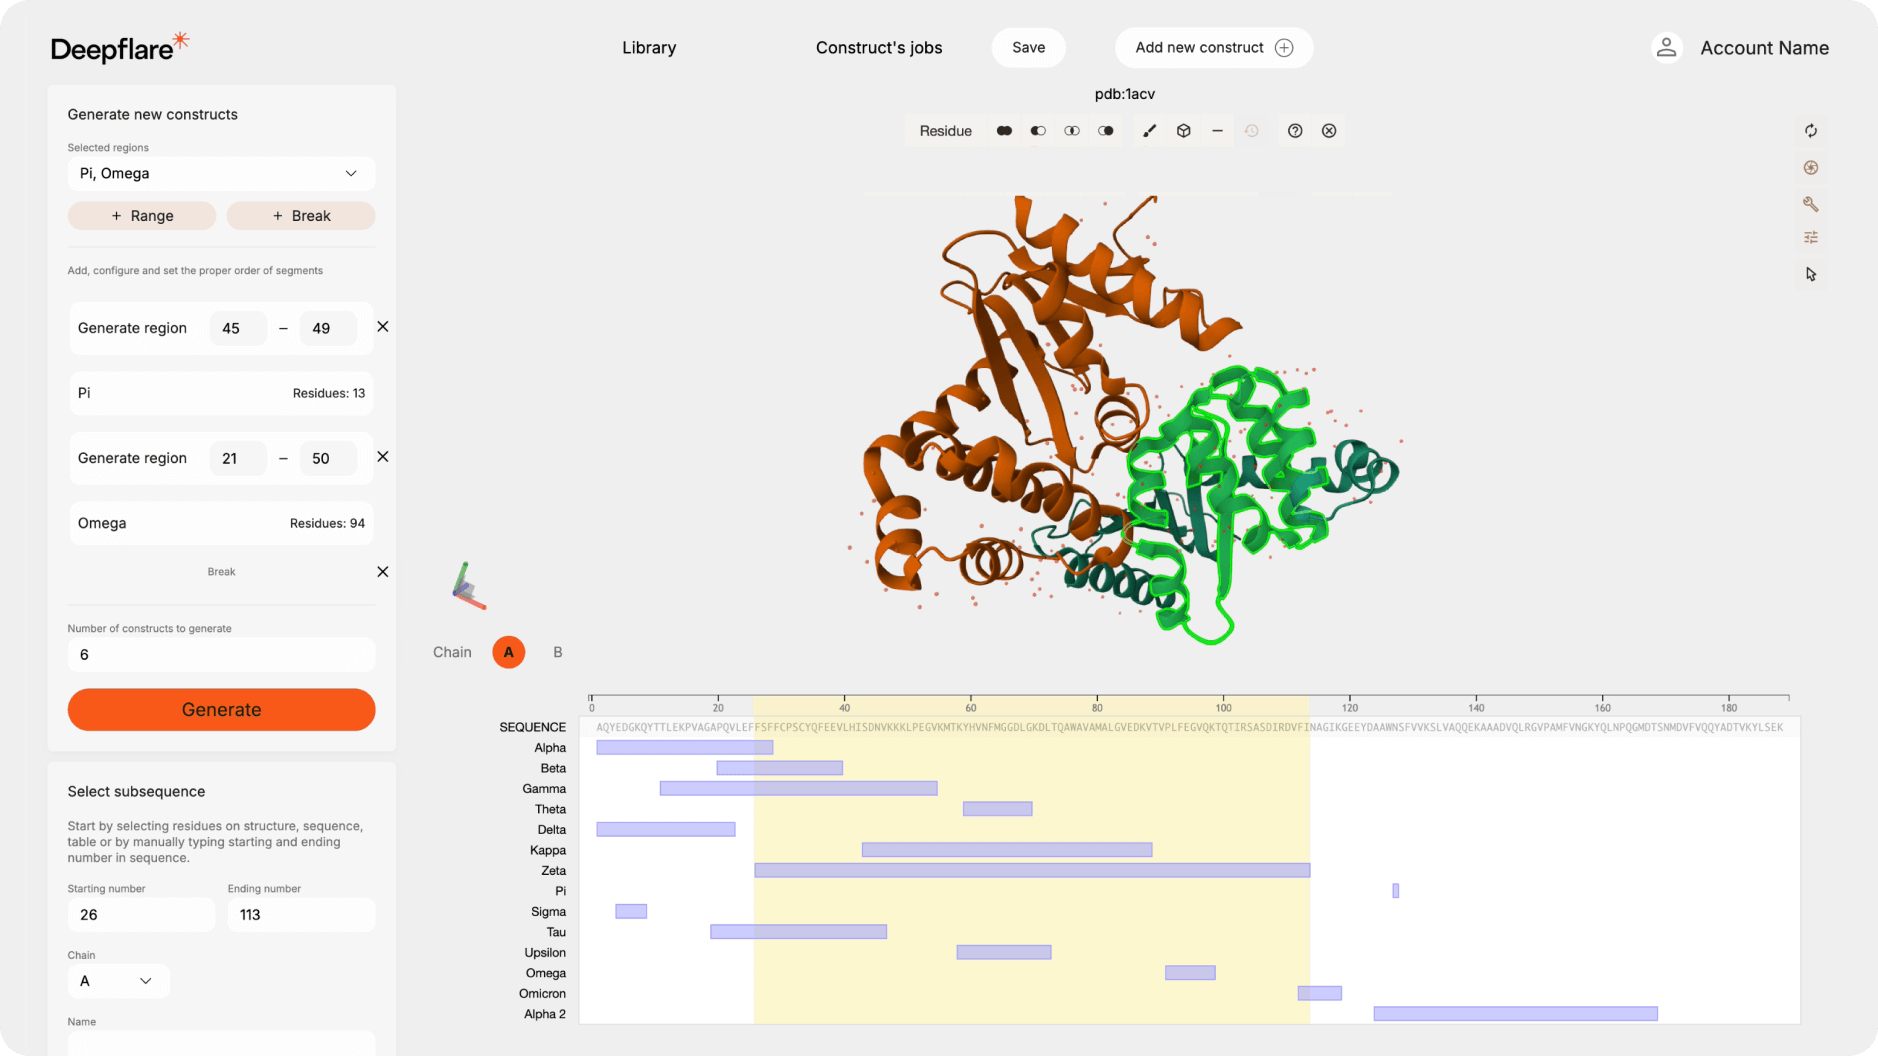
Researchers needed to access powerful AI protein prediction models. We help build a complete frontend platform integrating AI predictions with interactive 3D protein visualization, enabling scientists to work independently without coding.
 See full Case Study
OpenRunner 2020
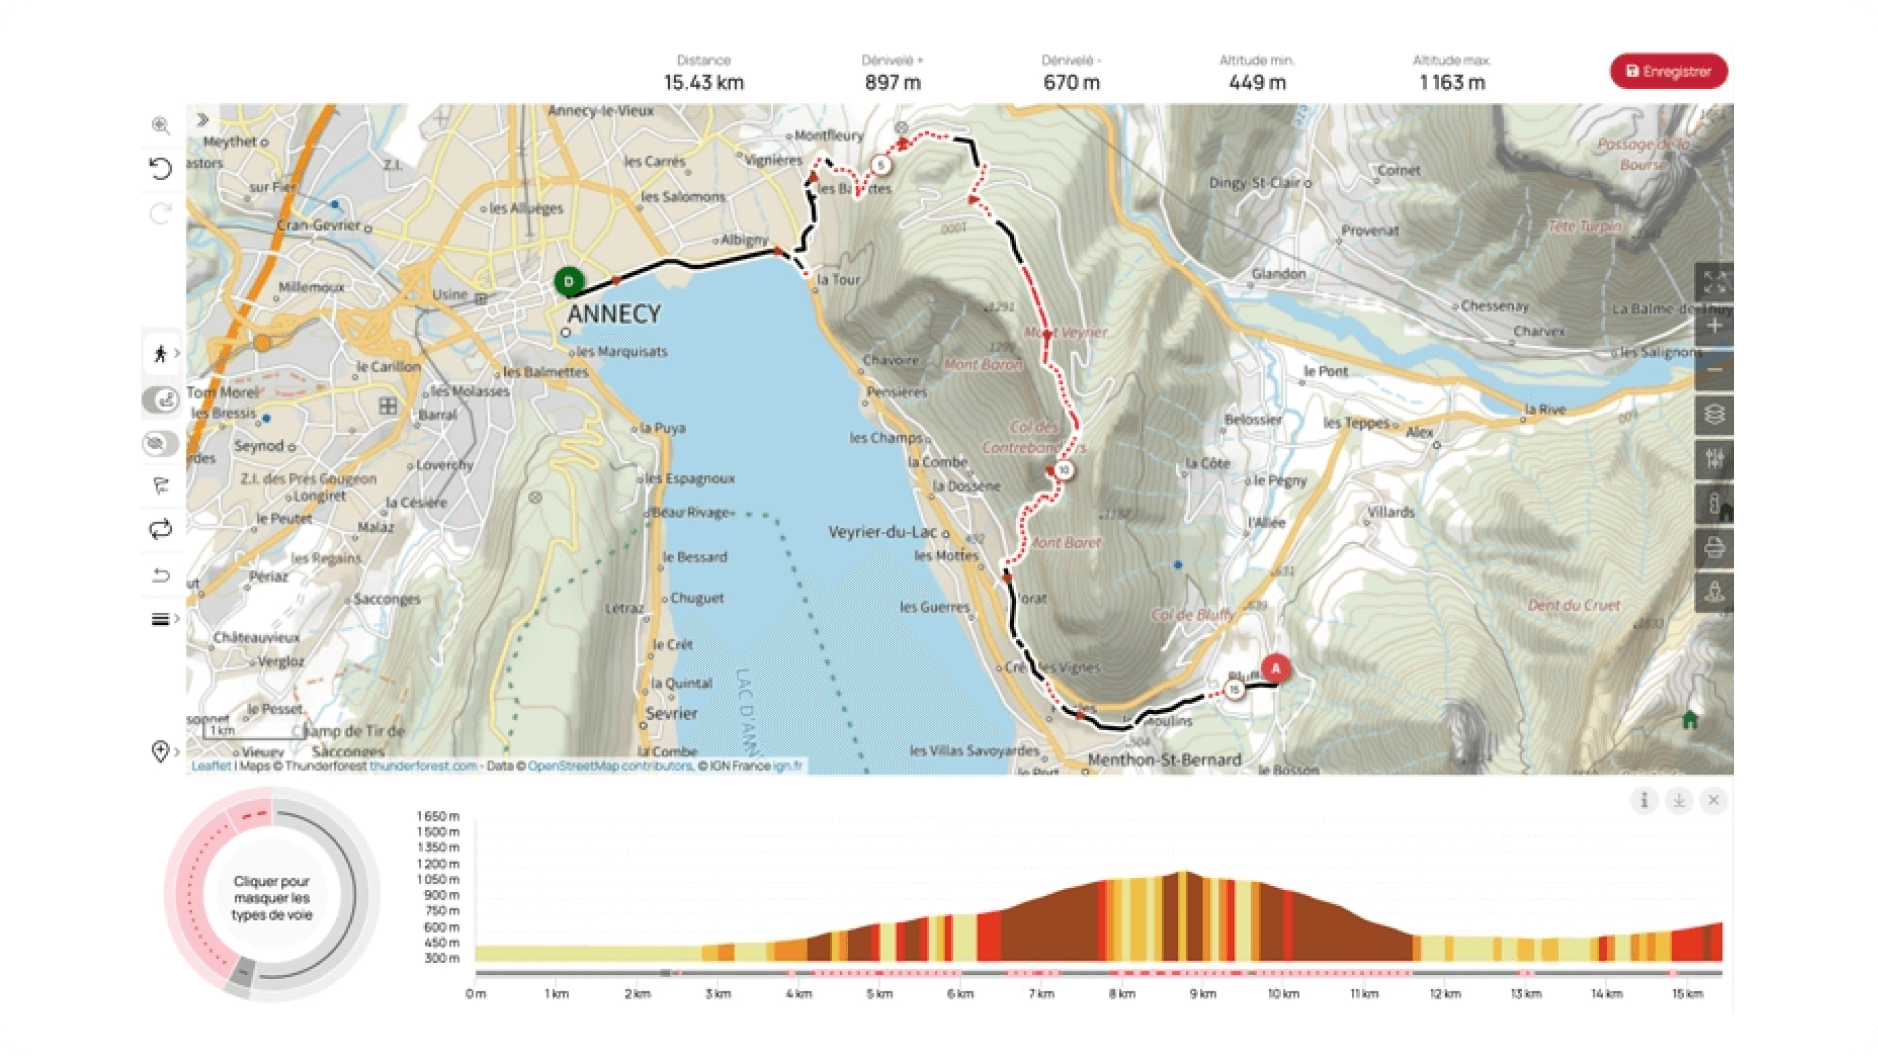
A French outdoor platform needed elevation charts with road type visualization beyond standard charting libraries. We built custom interactive profiles synchronized with maps, enabling users to analyze route difficulty and terrain in a single view.

The team behind Highcharts trusts us with core development and recommends us for any Highcharts-related work.

We actively develop and maintain Highcharts extensions used by thousands of developers worldwide.