Turn Complex Research Data Into Actionable Insights
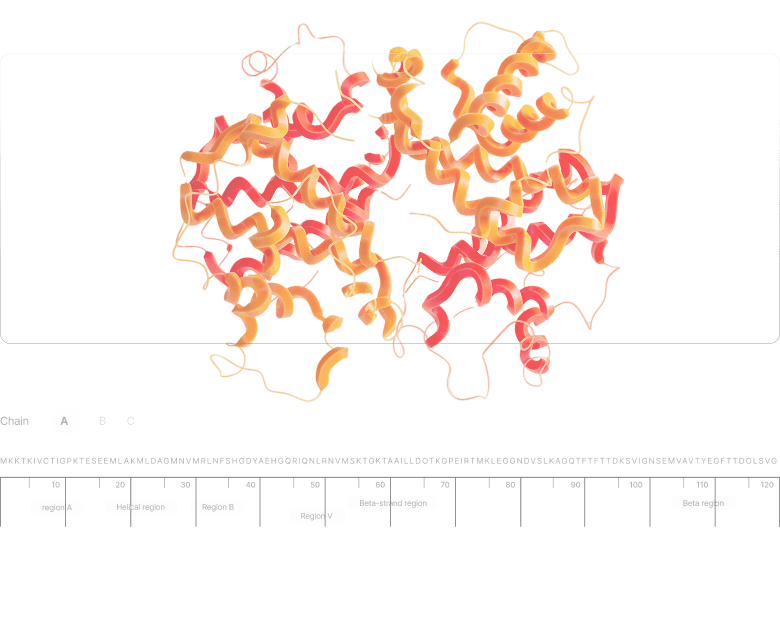
Spend less time wrestling with data and more time making discoveries.

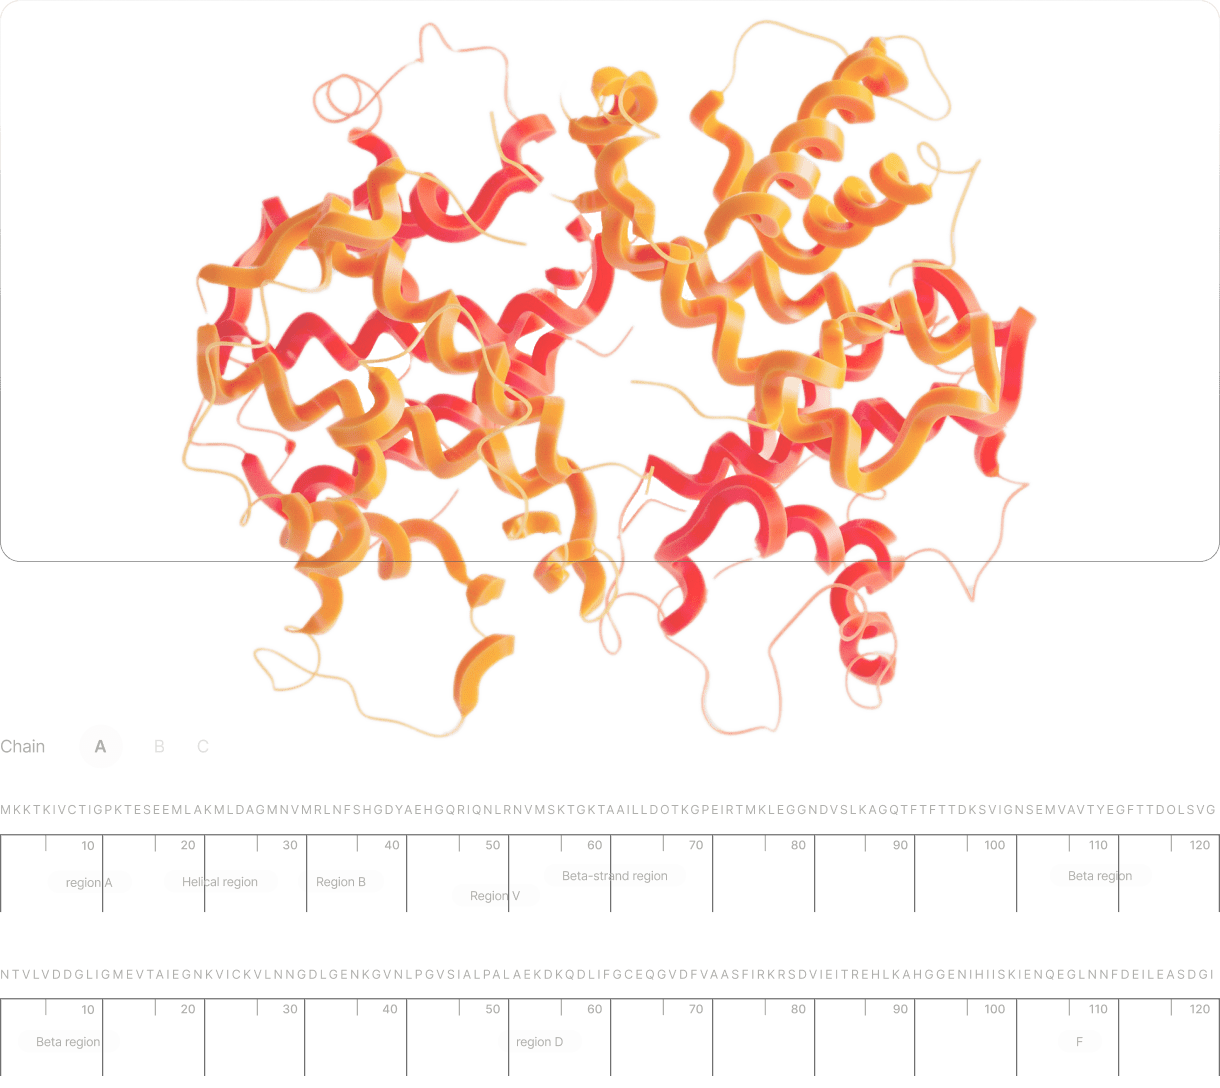
Working with Life Sciences Data is Challenging:
Scattered
Results
Results are spread across multiple systems and formats
Complex
Datasets
Dense datasets that are hard to explore and share
Limited
Tools
A lack of visualization tools for specific R&D workflows
Compliance
Pressure
Pressure to meet standards for traceability and reproducibility
Purpose-Built Data-rich Interfaces for Scientific Discovery – the Perfect Solution
- Interactive Charting Tools
Explore biomarkers, endpoints, trial results dynamically - Research Dashboards
Unify streams of experimental data in one clear view - Real-Time Medtech Interfaces
Monitor devices, collect and display live data - LIMS/ELN Integrations
Ensure compliance, reproducibility, and auditability
Recent Partners
| Deepflare | Harvard Medical School | |
|---|---|---|
| Problem |
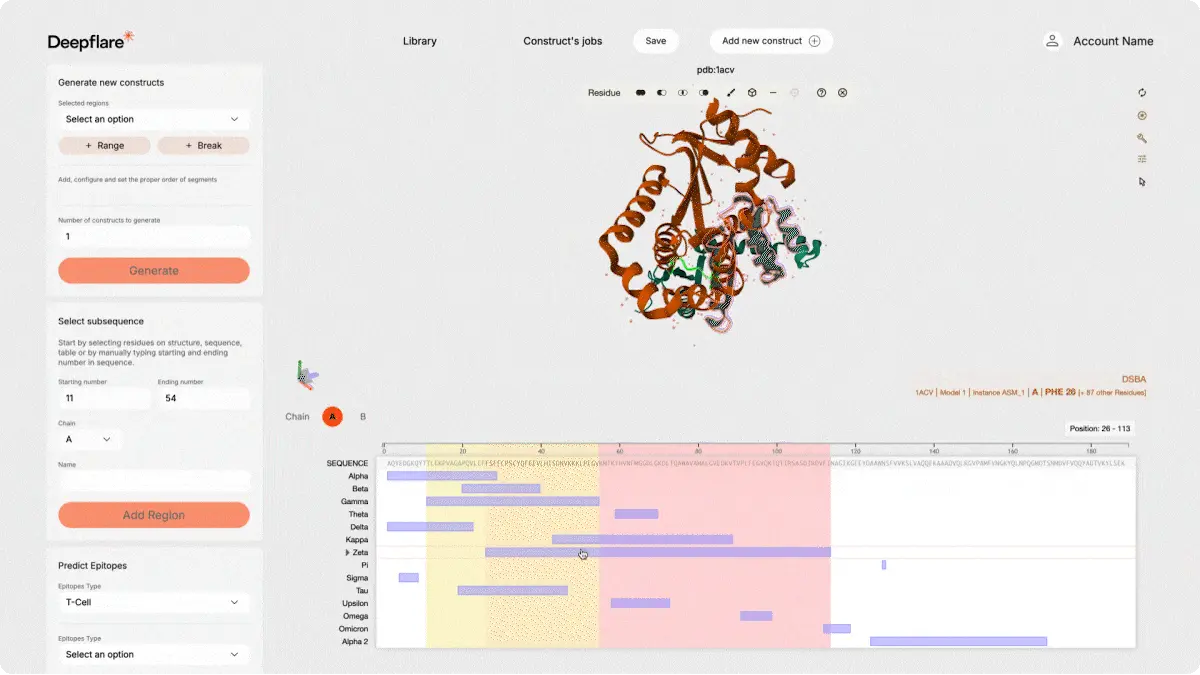
Deepflare needed an interactive application that would translate the raw power of AI into an intuitive tool for Biotech researchers to analyze amino acid sequences.
|
As part of Harvard Medical School’s ongoing cooperation with Mass Eye & Ear Institute, they needed help modernizing the Ophthalmology Outcomes Book – a comprehensive annual report highlighting patient outcomes, quality of care, and research metrics.
|
| Solution |
We collaborated with Deepflare to design and develop an integrated platform for construct management, epitope prediction, protein generation, and structural comparison.
|
Historically published as a PDF, we helped them develop the digital-first, interactive charts to improve accessibility, usability, and ongoing maintainability.
|
Deepflare
Problem
Deepflare needed an interactive application that would translate the raw power of AI into an intuitive tool for Biotech researchers to analyze amino acid sequences.
Solution
We collaborated with Deepflare to design and develop an integrated platform for construct management, epitope prediction, protein generation, and structural comparison.
Harvard Medical School
Problem
As part of Harvard Medical School’s ongoing cooperation with Mass Eye & Ear Institute, they needed help modernizing the Ophthalmology Outcomes Book – a comprehensive annual report highlighting patient outcomes, quality of care, and research metrics.
Solution
Historically published as a PDF, we helped them develop the digital-first, interactive charts to improve accessibility, usability, and ongoing maintainability.
Discovery
1.0
Design
2.0
Delivery
3.0
We’ll work with you to understand what you want to build, help scope your project, benchmark against the competition, collaborate on hi-fidelity designs before we even write a line of code to ensure that we deliver the best possible solution.

Let's talk!
Frequently Asked Questions
Timelines depend on scope, but many projects move from prototype to live environment in a matter of weeks.
Both. Platforms can support internal research workflows or provide clients with transparent, real-time access to project data.
Solutions are modular and scalable. Features can be added or extended as scientific programs advance.
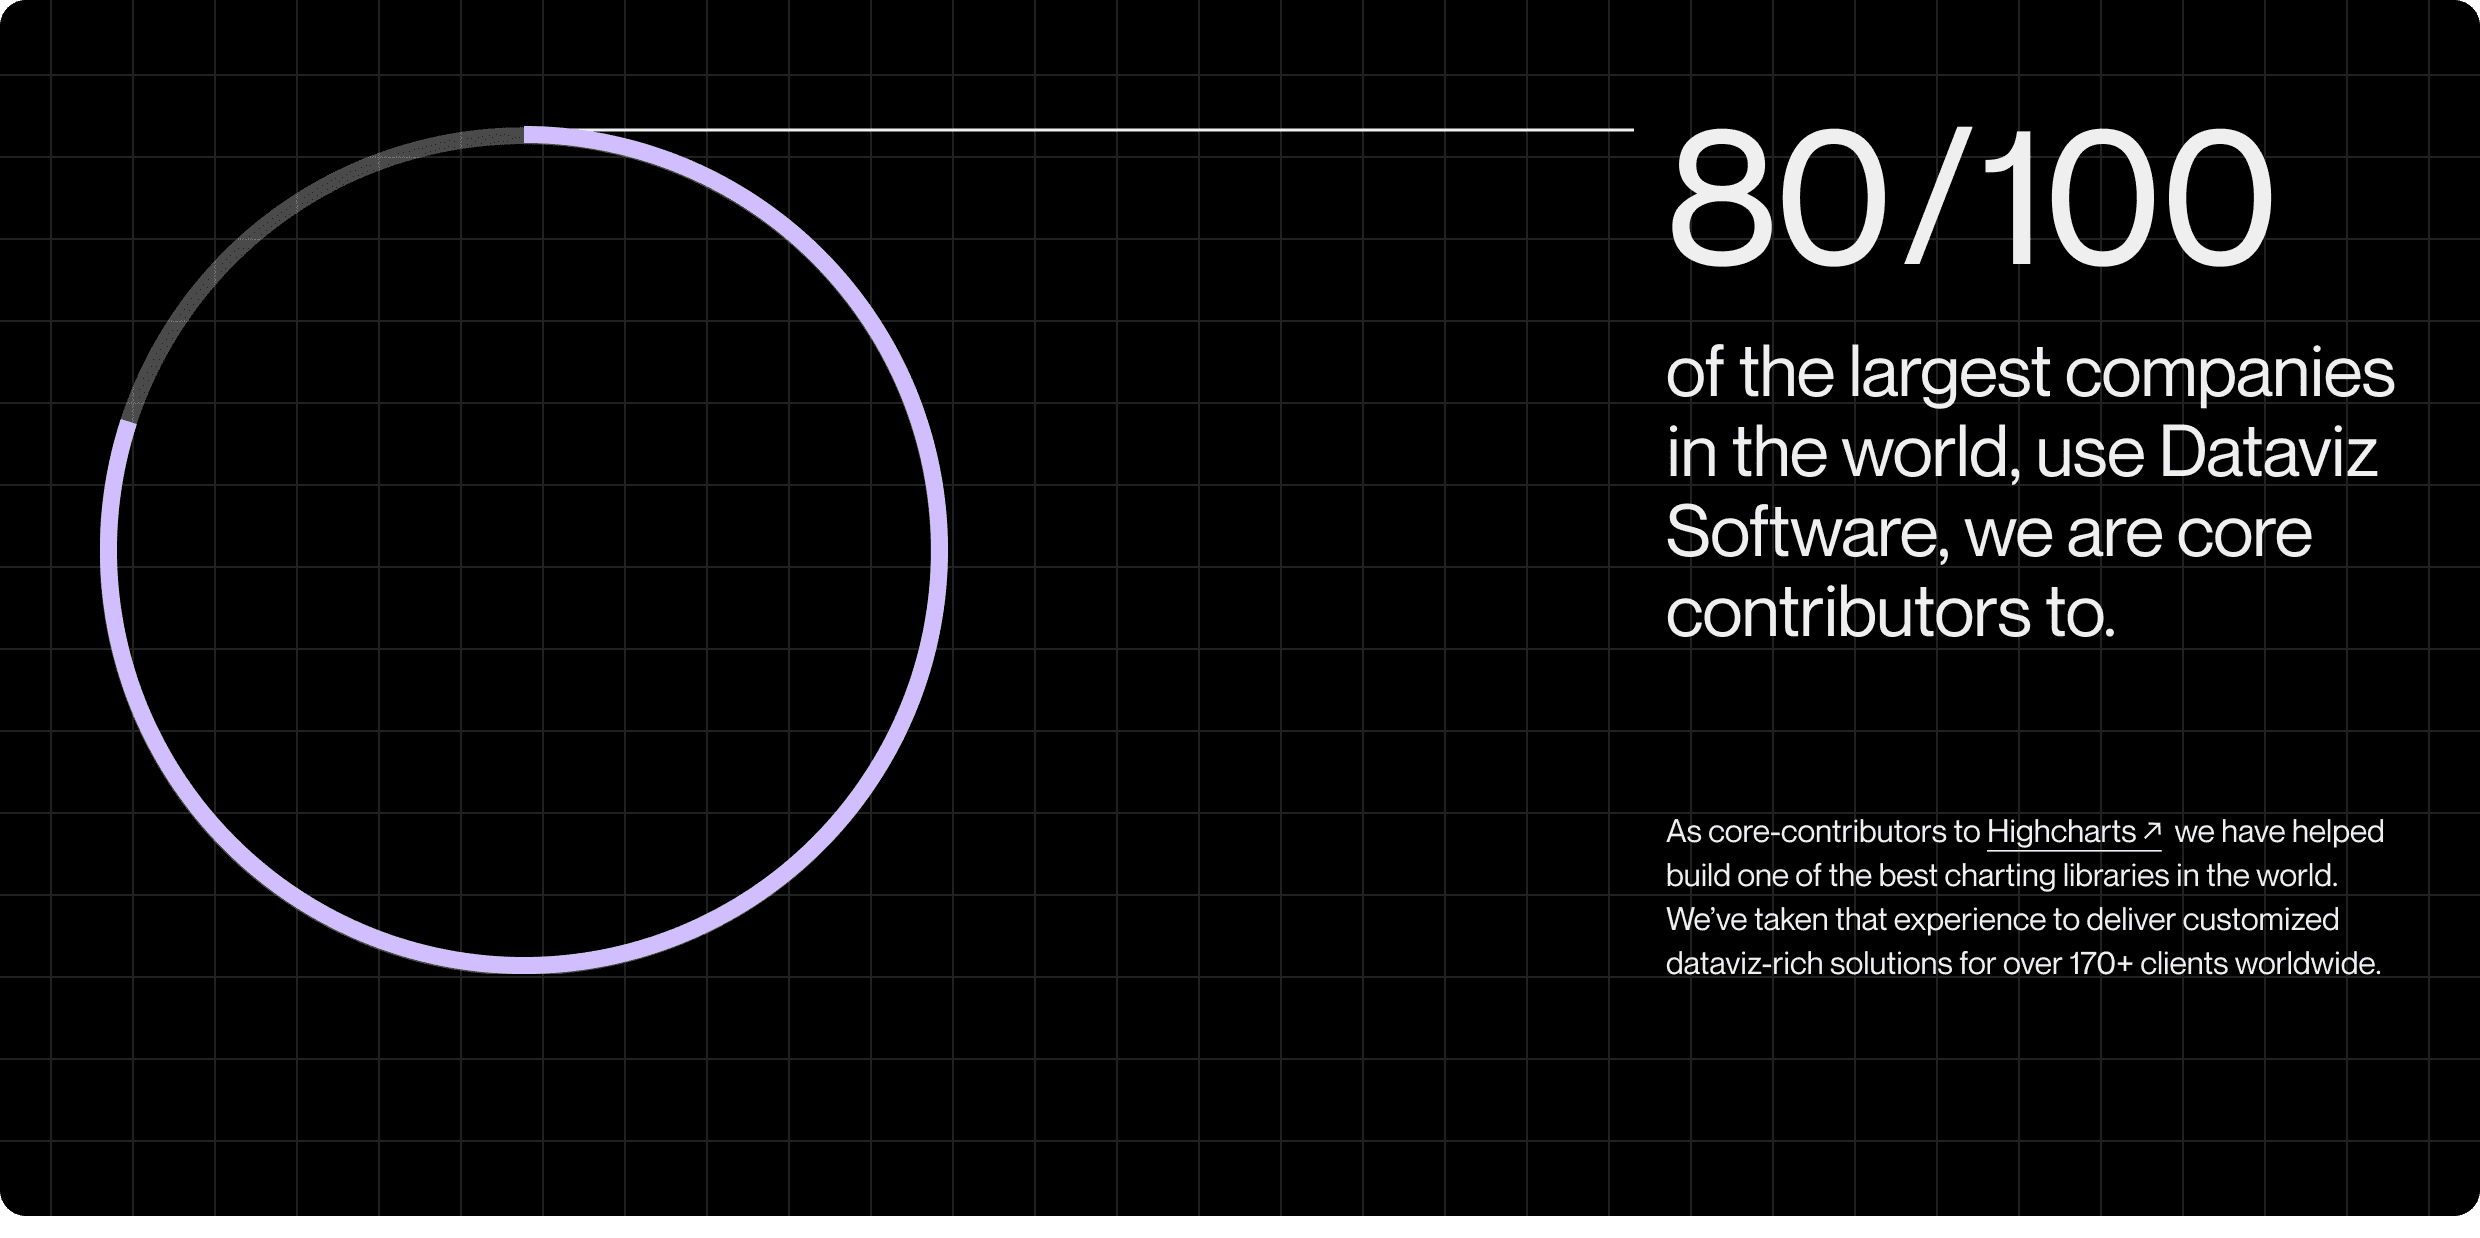
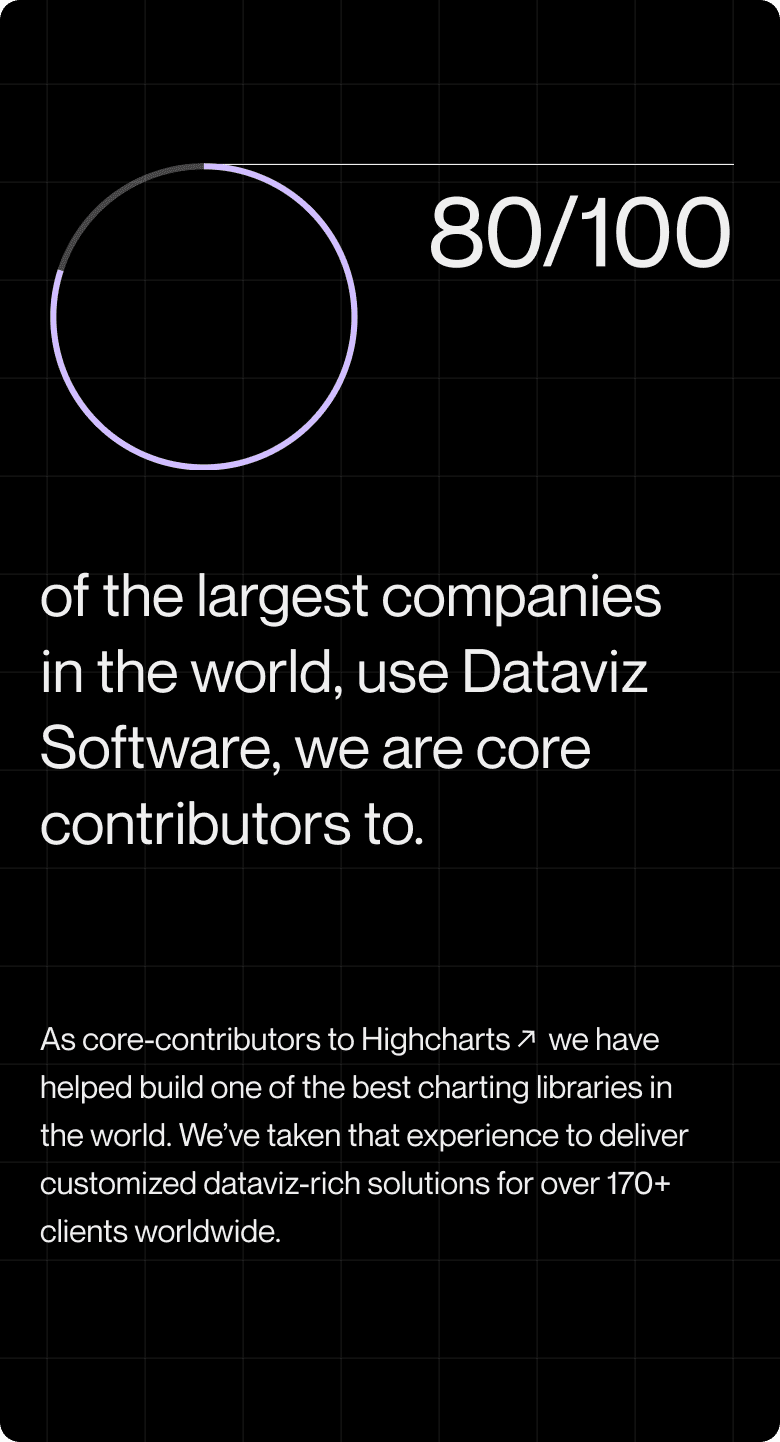
Our data visualization tools are trusted by 80 of the Fortune 100 and over 170 organizations worldwide, including teams in regulated industries.
Not necessarily. They often complement existing infrastructure, unifying data streams and providing interfaces better suited to exploration, analysis, and reporting.

